By NICHOLAS DeLIA
It is critical that fire departments take up some form of risk and hazard assessment to provide guidance for present and future needs. This informally happens daily around the firehouse kitchen table. Our people often willingly share their frustrations and concerns regarding specific addresses and individuals with which they interact, or they may identify dangers or potential incidents they come across. Although this information may get shared up the chain of command, unless there is a formal upsharing process, it probably will not make an investigation or a research phase unless it is life threatening.
- The Essential Elements of Community Risk-Reduction
- A STRATEGIC PLANNING MODEL FOR FIRE DEPARTMENTS
- Get A Quick Start On Meaningful Strategic Planning
- Master Planning and the Planning Continuum
The first product you need to develop in any community risk reduction (CRR), community education, or strategic plan; Standard of Coverage effort; or FIRE Act grant process is a formal community risk assessment. It is critical that you do the research necessary to identify not only what you are doing but also what trends are heading your way. The final community risk assessment document is a direct reflection of the dedication and amount of effort and work it received. It can range from the most basic to the most thorough, known as the aforementioned Standards of Cover.
Inside Our Community Data
As previously stated, the kitchen table can initiate an issue that needs to be investigated. However, the process cannot start and stop there. As with any good research, we need to ask the basic questions of who, what, where, when, and why. The first formal step is to review the documentation created by the department.
Data is created for numerous reasons and requirements. The National Fire Incident Reporting System (NFIRS)-based Emergency Reporting System or its applications contain an enormous amount of data. One issue that can develop (and which often does) is bad data. The term “garbage in/garbage out” is a hidden danger in the data-gathering process. It is critical that internal standard definitions and spellings are developed to express common situations and locations. The NFIRS training program is available to help with this process.
Local issues and differences often impact the traditional NFIRS definitions. All reporting programs can export data in an electronic or a digital spreadsheet-based format; you may need to contact the vendor to determine how to do this. The upside of this process is the ability to develop the specific data you are looking for regarding your community and its issues. The term in the business to determine specific issues is to create a “plus-one entry,” which is an additional digit you can add to traditional codes to document specific questions such as jurisdictional boundaries. If a road is on a jurisdictional border and you wanted to count how many times you went to their side of the road for mutual aid, you would add a digit onto the appropriate code. The reporting software is basically a data management tool; it just sorts data based on programming provided by your vendor. If you ask any reporting or data management company for which reports they can provide, the number is amazing. However, as stated before, the quality of the data is critical. The NFIRS reporting program does nothing for misspelled roads, occupancies, and so on. For example, if the incident is at 123 North Smith Street, the entry could be any of the following:
- 123 North Smith.
- 123 North Smith St.
- 123 N. Smith St.
- 123 North Smith Street.
- 123 N. Smith Street.
Although all reflect a version of the address, the program will see multiple locations, which is a problem when you use electronic spreadsheet tools. It is important that everyone making the reports use the same basic rules, spelling, and terms; if not, the researcher will have to try multiple versions and add them all up. Correct spelling is a basic skill that can cause havoc with the system.
Figure 1. “Small” Fire Department Alarm Responses by Type, 2018-2021
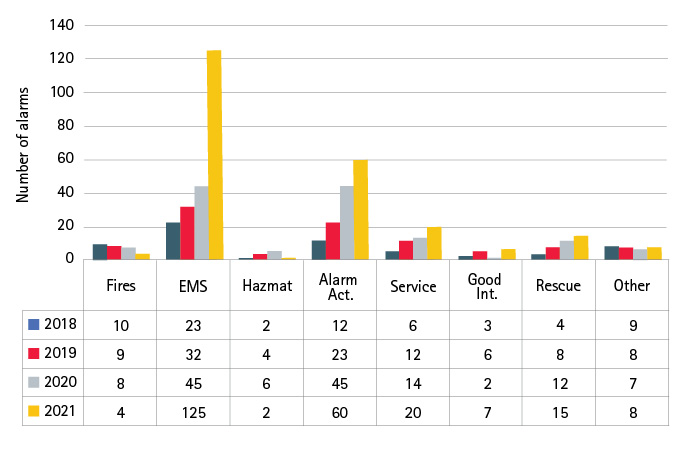
Figure by author.
Figure 2. “Small” Fire Department Responses by Call Type, 2018

Figure by author.
Figure 3. “Small” Fire Department Call Types by Percentage, 2018
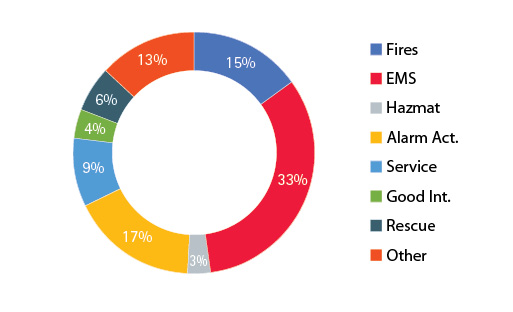
Figure by author.
The good news is that these programs can export the data in an electronic spreadsheet format. The processes are all different, so your vendor can explain how to do that. You may need to “clean up” the data—electronic spreadsheets have specific rules for doing calculations. There is an order and organization that needs to be in place for the program to work including vertical alignment. However, once the program can work, it can be extremely helpful and be used for everything from determining frequency of emergency type and repetitive locations to training and member participation levels. Once any issue or trend is determined, it can be visualized as a chart.
I have found that the public, elected officials, and community leaders can better understand some of our points with basic visual presentations. Figure 1 shows the types of alarms responded to by a “small” fire department between 2018-2021. Can you see any trends relative to our changes in service demand? You can also focus on one year and then choose the best style of chart for you audience.
Figures 2 and 3 look at 2018 by type of call. There are numerous ways to display the same information. In today’s budget-conscious world, someone in your fire department knows or should know how to use these tools. A nontraditional way is to use the program’s many options. One of the more interesting options is using specific electronic spreadsheet formulas, functions, and compatibility and a conversion app, which allows you to change the addresses to the latitude and longitude of the incidents. The many apps and Web sites you can use are free or low cost. If you send that data to your GIS people, they can produce a map showing any or all of your responses.
Figure 4. Emergency Events for Lebanon, Connecticut
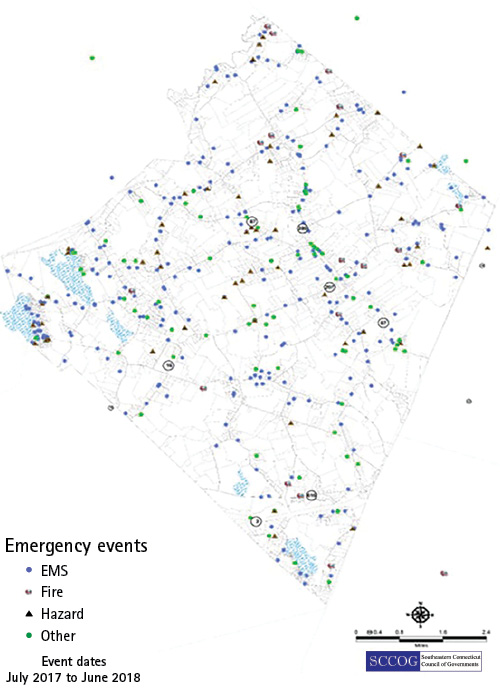
Figure courtesy of Lebanon (CT) Volunteer Fire Department Chief Jay Schall.
Standards of Coverage
Advancing to the Standards of Coverage level will be critical for your response/planning zones. One example of this follows.
Although we are most familiar with our reporting systems, we will need other data. The fact that we spend between 60% and 80% of our time doing medicals sends us to those records for a similar review. Again, they are often based on data processing and can be used for determining present and future risks. Several of our community partners will be able to share their results with us and will be doing the same type of research when trying to get some funding. These collaborators would include the dispatch centers, police departments, emergency medical services agencies, hospitals/public health, emergency management, and the American Red Cross.
Some of our best allies in determining hazards are our emergency management colleagues. Many times, the fire department has inherited this responsibility. Many communities have local emergency planning committees because of hazardous materials requirements in the Superfund Amendments and Reauthorization Act. These groups will have done research for chemical risks and hazardous industrial procedures. Also, many communities have emergency management plans; again, these are great resources to gather information. Many communities belong to some form of regional councils of governments, chambers of commerce, or state municipal associations. These organizations traditionally do research to help the local governments answer regional or statewide questions. And don’t forget social service agencies, which have become more important to many of our citizens than ever before.
Outside of Community Research
At this point, we need to reach outside our comfort zone and get on the Internet. The U.S. Census is excellent for answering various questions relative to the people we protect as well as their domestic situation. The Census Bureau collects an enormous amount of demographic information that not only can assist you in knowing your community’s population and characteristics but also can help prepare you for future services and assistance level demands. Again, this information is available online (https://data.census.gov/cedsci/) and can be used for all your required research for grants, assessments, and so on. For example, by using the Census data, my department determined that our poverty level was not only the highest in our town, but we were also higher than the county and state averages. These stats helped secure a FIRE Act grant we had been working on.
In addition to the Census data, there are also other online resources such as City-Data.com (https://www.city-data.com). Whatever source you are using, you must identify the dates the data was collected. Some of the information may be quite dated. In the Census case, it may also be a prediction based on past years. Either way, it will give you a vision of your community.
Putting It All Together
Once you have gathered as much data as you can, it’s time to construct an outline and begin filling in the blanks. You may be able to use a previous assessment to help you sketch out a plan. If not, there are many examples of research projects in your community. Most communities have had to do similar work for grants or other programs. You may find free examples or tutorials on the Internet.
If all else fails, go back to the five questions mentioned above: What are the hazards? Where are the hazards? Who does the hazard endanger? When are the hazards most dangerous? Why are they dangerous? Once you have a clear picture of your community’s hazards, you can begin a CRR plan. The “5 E’s” of CRR are Education, Engineering, Enforcement, Economic Incentives, and Emergency Response.
The use of these concepts is more important to small communities than large ones. When you’re small, you can’t often overcome the problem just by calling for more help during the emergency; you need to prevent and proactively control the emergency beforehand. Be as prepared as possible and take as many steps as possible to prevent loss of life and property.
NICHOLAS DeLIA is a 40-plus-year fire service veteran and the chief (ret.) of and fire marshal for the Groton (CT) Fire Department. He is certified as a Connecticut State fire officer IV, fire instructor II, safety officer, and hazardous materials technician. DeLia has also served in leadership roles in state and regional hazardous materials response and urban search and rescue and incident management teams. He is a senior fire service consultant for JLN Associates and a contract instructor for community risk reduction programs at the National Fire Academy. DeLia has a BS in fire service administration from Empire State College.

