The Fukushima Daiichi nuclear disaster was a series of equipment failures, nuclear meltdowns, and releases of radioactive material at the Fukushima I Nuclear Power Plant following the 9.1 magnitude Tōhoku earthquake and tsunami on March 11, 2011.1 Units 1, 2, and 3 were operating at full power; units 4, 5, and 6 were already shut down for scheduled maintenance. The operating units shut down automatically as designed at the time of the earthquake. At the same time, all off-site power was lost.2
Huge seismic activities knocked out the power at the Fukushima Daiichi Nuclear Power Plant, and ensuing tidal waves disabled the backup generators for cooling systems to the active reactors. This triggered a series of hydrogen explosions and released dangerously high levels of radioactive particles into the atmosphere.3
RELATED
Human Reliability Quantification in Severe Nuclear Accidents
Fire Probabilistic Risk Assessment of Nuclear Reactors
Fuel rods create high temperatures that boil the water and turn it into steam. In the absence of fresh water to cool, the rods keep on warming up. As soon as the rods reach more than 1,200°C, an interaction between the zirconium and the steam will take place and split the hydrogen from the water. That hydrogen can then be released from the reactor core and containment vessel. If it accumulates in adequate quantities (concentrations of four percent or more in the air), it can explode, as actually occurred at reactors 1 and 3 and probably reactor 2 as well. The 9.1-magnitude earthquake released a surface energy (Me) of 1.9 ± 0.5 × 10¹⁷ joules.4
Equation 1 shows how zirconium interacts with steam to produce hydrogen:
Zr + 2 H2O —> Zr O2 + 2 H2
The presence of the hydrogen in the reactor building resulted from leaks in the containment because of the high pressure and perhaps from the high containment temperatures that could have caused the major seals (e.g., drywell head cover and equipment and personnel airlocks) to deteriorate. Another possible source could have been leakage past containment isolation valves.5 This hydrogen buildup led to hydrogen explosions at the reactor service floor in reactors 1 and 3.
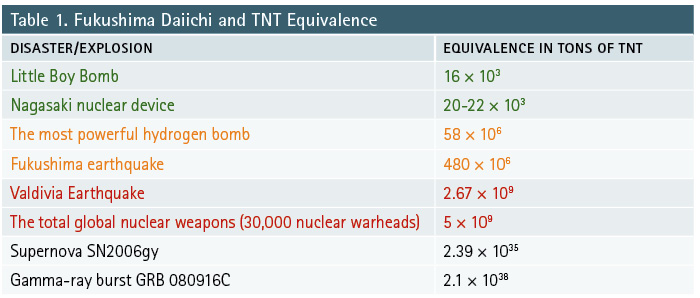
Explosion TNT Equivalents
The earthquake is estimated to have involved two 50-mile-thick tectonic slabs and unleashed the energy equivalent to about 480 megatons of TNT, moving the position of part of the coastline 3.6 miles east. The strongest earthquake the world has seen had a magnitude of 9.5 and 2.67-gigaton TNT equivalent, 11.2 EJ release in Valdivia, Chile, in 1960. The 1945 Nagasaki nuclear device yield was in the range of 20 to 22 kilotons of TNT equivalent. The energy release is thus equivalent to about 480,000/20 = 24,000 of such devices. Because of the enormous energy release, the seabed buckled along a 300-kilometer (km) stretch along the fault line involved. An estimated 67 km3 of ocean water moved toward 860 km of the Japanese coastline with a wave reaching about 24 meters high.6
Table 1 compares the amount of energy released in the earthquake with that of the energy release in historic nuclear explosions, a similar earthquake, and astronomical events.
Fukushima Accident Progression
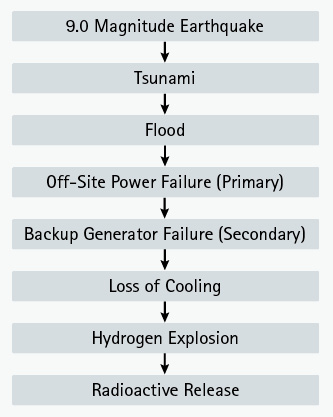
The Fukushima accident started with a huge earthquake in the ocean that created a tsunami. Once the tsunami reached the plant, it created a flood, which caused a primary loss of power, followed by the secondary loss of power (the backup diesel generators). The power loss disabled the pumps, which, in turn, caused a loss of coolant. The water vapor level expanded, the temperature kept rising, and the zirconium rods were able to split up the water vapor into zirconium oxide and hydrogen (see Equation 1). Hydrogen kept building up until it reached the lower explosive limit and exploded, which resulted in radioactive release as shown in Figure 1.
Figure 1. Accident Progression
Fire Probabilistic Safety Analysis
Fire probabilistic safety analysis (PSA) is a rigorous tool for identifying accidents and assigning frequencies to them. The most challenging event for nuclear operators is a very low-frequency incident that has very large consequences. The nuclear operator must accept a certain residual acceptable risk. Fire PSA and other PSAs show how the administrative and engineering control will behave in different scenarios.
Fire PSA uses a top-down approach to generate the failure frequencies of operating systems and the failure probabilities of safety systems (fault trees). It then combines failure of each operating system with successive failures of the required safety systems to obtain a long list of accidents and their frequencies (event trees). One can also select design basis accidents from this list if they have not already been picked up by other techniques.7
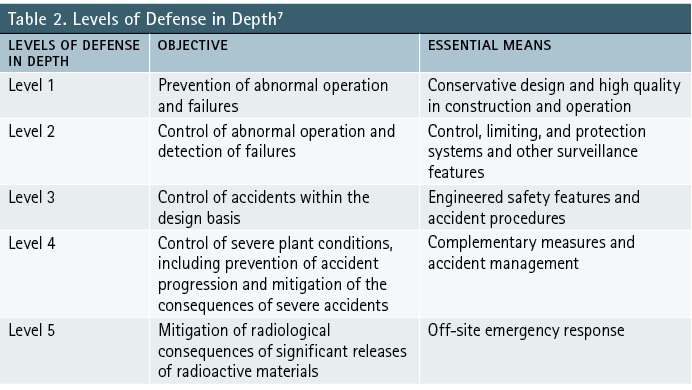
Fire PSA addresses the overall fire risk and gives an integrated, structured framework for safety analysis, which permits comparisons with accepted risk tolerance criteria or numerical targets and supports the design basis analysis (DBA) by providing systematic resources for examining dependencies and complex interactions between systems. DBA is used to ensure that the design is robust, is fault tolerant, and has effective safety measures, whereas fire PSA ensures that the overall risks are acceptable and balanced and that the strengths, weaknesses, and interdependencies in the overall design are understood. Defense in depth means creating multiple independent and redundant layers of protection and response to failures, accidents, or fires in power plants as shown in Table 2.
Definitions
- Hazard is a chemical/physical condition that can potentially cause damage to people, property, or the environment.
- Severity (S) is a qualitative/quantitative estimate of hazard intensity in terms of time, distance, and source.
- Consequences (C) are excepted effect from the realization of hazards and severity.
- Performance-based barrier protection is a quantitative, probabilistic measure of the barrier efficiency and the effectiveness derived from specific scenario and risk tolerance criteria. The three primary factors are as follows:
- Response effectiveness success probability.
- Online availability success probability.
- Operational reliability success probability.
Risk is divided into mitigated and unmitigated risk. Unmitigated risk does not consider the performance of the loss control measures, whereas mitigated risk considers the barrier performance success probability (BPSP).
Risk = E × BPFP × C
(Equation 1)
E = Initiating event likelihood
BPFP = Barrier performance failure probability
C = Consequences (C)
Overall Risk = Σ (E × BPFP × C). (Equation 2).
Probabilistic risk assessment (PRA) usually answers the following three basic questions:
- What can go wrong with the studied industrial unit, and what are the initiating events that can lead to adverse consequences?
- What and how severe are the potential consequences of these initiating events?
- What are the probabilities or frequencies of these undesirable consequences?
The simplest steps to perform any fire PRA are as follows:
- Define a scenario, including the initiating event.
- Define your accepted residual risk.
- Use quantitative method.
- Prepare your resources (e.g., historical data, subject matter experts).
- Define all lines of defense for each event.
- Model or simulate all possible events consequences.
- Carry out your assessment.
Calculated Risk
Compare that against the statistics of skydiving accidents. According to the United States Parachuting Association, there are an estimated three million jumps per year, and the fatality count was only 21 in 2010. That represents a 0.0007% chance of dying from a skydive, compared to a 0.0167% chance of dying in a car accident (based on driving 10,000 miles). In nontechnical language, you are about 24 times more likely to die in a car accident than in a skydiving.
The National Safety Council compiled an odds-of-dying table for 2019, which further illustrates the relative risks of flying and driving safety. It calculated the odds of dying in a motor vehicle accident to be 1 in 107 for a lifetime. For air transport, the odds were so small that they were classified as “too few deaths in 2019 to calculate odds.”
Both of the statistics above illustrate that some events are more probable and have more severe consequences than others but may seem less probable with less severe consequences. Historical data is essential to quantify risks, to calculate the probability of an event to occur., and to measure the consequences.
Lessons Learned
“Absolute safety” is a myth. A disaster can be a sequence of different events; when developing a scenario to assess, you should model a series of events. Improving your severe accident management will improve overall system safety. Remember the CCC Rule: Cooling, Confinement, Containment. Human factors and the reliability of lines of defense have a major impact on overall system safety. Be very careful while assessing them. Emergency response ability must include having the staff and resources necessary to respond successfully to a severe condition at each reactor at a facility.
Possible Corrective Actions
Emergency power following beyond-design basis external events. The diesel generators, their fuel, and related switchgear could be stored in adequately high-elevation rooms and in waterproof rooms to conserve on-site AC power in case of tsunamis or floods.
Hydrogen management. Vent pressure vessels through strong pipes connected to the stack. Venting should be possible without power.
Plant siting and site layout. Layout and separation at multiunit sites could be improved. For example, at least one diesel generator room could be placed adequately above grade (for protection against tsunamis) and one below grade (for protection against plane crashes).
In the Fukushima accident, the barriers/controls that were to be depended on in a hazard event were no longer available—e.g., the flood disabled the backup generators. In the original PSA, they were to prevent a loss of cooling event. Hence, you should examine all barriers in the PSA closely to make sure they will remain reliable, available, and operational. Otherwise, you will need to address a gap in the analysis.
References
1. “Japan’s unfolding disaster ‘bigger than Chernobyl.’” New Zealand Herald. 2 April 2011. https://bit.ly/3cBlfVh.
2. “CNSC Fukushima Task Force Report, INFO-0824.” (2011) The Canadian Nuclear Safety Commission. https://bit.ly/3rGXhfE.
3. Fukurai, Hiroshi. “Introduction: The Fukushima Dai-Ichi Nuclear Disaster and the Future of Nuclear Energy Programs in Japan and East Asia.” 21 Pac. Rim L & Pol’y J. 427 (2012). Available at: https://bit.ly/3czN3cO.
4. United States Geological Survey (USGS). “USGS Energy and Broadband Solution.” Neic.usgs.gov. https://bit.ly/3rD1TUd.
5. “A Report by The American Nuclear Society Special Committee on Fukushima.” American Nuclear Society. March 2012 (Revised June 2012). https://bit.ly/3fuZgkT.
6. Ragheb, Magdi. (2011) “Station Black Out Accident at Fukushima Safety.” Seguridad y Medio Ambiente. 122, 2011. https://bit.ly/3wi3Atw.
7. The Essential CANDU – a textbook on the CANDU nuclear power plant technology. 2014, 2015 UNENE. https://bit.ly/2PqB3RY.
Hossam Shalabi is a fire protection specialist for the Canadian Nuclear Safety Commission and a registered professional engineer in Ontario. He has two master’s degrees in engineering and a Ph.D. in fire safety engineering. He has more than 15 years of experience in applying fire engineering principles in the nuclear, manufacturing, oil and gas, defense, and consulting industries. Shalabi has more than 16 publications and he serves on several National Fire Protection Association (NFPA) technical committees, including those for the NFPA 801, NFPA 804, NFPA 805, and NFPA 806 standards.

