By Rodrick Wallace and Deborah Wallace
The New York City Emergency Medical Service merged with the Fire Department of New York (FDNY) in 1996. In 2016, the Canadian Broadcasting Corporation (CBC) provided an in-depth analysis of the process and some of its consequences.1 Even at the time of the merger, the number of medical emergencies vastly exceeded the number of fires. In this article, we’ll examine the more recent consequences of that ratio and of the assignment of fire units to respond to medical emergencies in the Bronx and Manhattan.
- Fire Service EMS: The Challenge and the Promise
- EMS Is Not a Distraction from Our Job, It Is Our Job
- How EMS Calls Benefit the Fire Service
- Why EMS Cross-Training is a Great Idea
We have studied the 1970s closing of NYC fire companies and cuts in other fire control resources since 1975. Our first book, A Plague on Your Houses: How New York Was Burned Down and National Public Health Crumbled, exposed the scientifically deplorable bases of fire company cuts between 1972 and 1976 and many of the consequences.2 Later peer-reviewed publications analyzed public health consequences of the massive loss of housing to fire between 1970 and 1980 and even showed how the extreme loss of companies resulted in the Bronx emerging as the national epicenter of the first wave of COVID-19.3,4,5 In these publications, we illuminated the historic trajectory linking housing loss, unraveling of community social fabric, and public health crisis. The ecological nature of the system of a large, densely populated city allowed us to use analytical approaches from natural ecosystem science.
The Bronx has suffered the public policy hate crimes of redlining, urban renewal, and planned shrinkage (especially loss of fire service) in a series of policy decisions that began in 1938 and has continued into the present. 6,7 The Bronx has been designated as the unhealthiest county in New York State for many years.8 The merger of FDNY with Emergency Medical Service closed the circle of interaction between building fires and public health. In this article, we demonstrate this interaction by comparing the Bronx, the poorest borough of New York City, with Manhattan, the richest borough. The two boroughs have similar population numbers (1.47 million and 1.65 million) and rather similar population densities.9
We previously found that the total number of units assigned to structural fires declined in each of the two boroughs between 2005 and 2020, although the number of structural fires in the Bronx did not decline but surged and ebbed around a high level in a pattern similar to hyperendemicity.7 The number of large fires increased in each borough during that period. The hypothesis central to this article is that the annual number of fire unit responses to medical emergencies in each borough drove the annual number of large structural fires via strain on firefighting resources. As medical emergencies increased, the number of large structural fires increased.
Our findings have implications for large, densely populated cities and their emergency response services. What kinds of impact assessments are adequate for predicting the consequences of major service changes and service mergers? Environmental and public health impact assessments provide examples of how to predict ranges of impacts and their cascading consequences. Impact assessment as a science and art came of age in the 1970s and has evolved for half a century since the Calvert Cliffs court decision, which required environmental impact assessment for projects with potential for environmental damage. Service changes with the potential for great harm require sound impact assessment before being implemented.
Data and Methodology
All data came from the FDNY open-access dispatchers’ database. Each incident reported to dispatchers has a row in that database. The columns include the location of the nearest firebox; the ZIP code; election district; congressional district; community planning district; incident classification; date; various relevant times; and number of engines, ladders, and other units assigned. The major incident classifications include structural fire, nonstructural fire, medical emergency, nonmedical emergency, medical false alarm, and nonmedical false alarm. Another incident classification column provides further details. For example, a structural fire will be further classed as multiple dwelling, private residence, factory, store, school, hospital, or business.
The database begins with 2005 and the last full year is 2020. As of late July 2023, it had not been updated since April 2022; it ends mid-2021. We use the 16 full years of 2005 to 2020.
Colleagues at the Christian Regenhard Center for Emergency Response Studies at John Jay College (City University of New York) downloaded the database and sent us separate files of the Bronx and Manhattan chunks, which we imported into the database management program Microsoft Access 2016. By year, we copied separate spreadsheets for structural fires, medical emergencies, and nonmedical emergencies for each of the two boroughs into Microsoft Excel 2016. When we sorted the spreadsheets by ZIP code, we found that 1 to 5 percent of each incident class annually had not been geocoded. We also found that a few incidents were assigned to the wrong borough. So we have the caveat that this database was made accessible without good quality control and may include mistakes. We assume that the great majority of entries is free of mistakes and that en masse the patterns revealed by these data are true and not artifacts of errors in the original database. This paper deals with boroughwide statistics and does not suffer from the small number of incidents geocoded only to the borough level.
We defined “large structural fire” as one to which at least 6 engines were assigned. Standard engine assignment for a structural fire is 2 to 3 engines. Thus, we defined a large structural fire as one to which 2 to 3 times the number of engines of a standard alarm assignment were assigned. This definition is conservative. Fires assigned 5 engines, 5 ladders, a battalion chief, and 4 other units are not rare but would not have been counted as large fires under our definition. Later work will address better definition of “large structural fire” but the 6-engine definition has proven a valuable indicator of areas subject to serious fire damage.7
We did not rely on such labels as “all hands working” or the higher alarms to define large structural fires because the number of assigned units and the time required to control fires with these labels varied greatly. The labels seem arbitrary. An “all-hands” can vary between a minimum of the standard alarm assignment of 3 engines, two ladders, and a chief up to 9 engines, 5 ladders, a chief, and 4 other units.
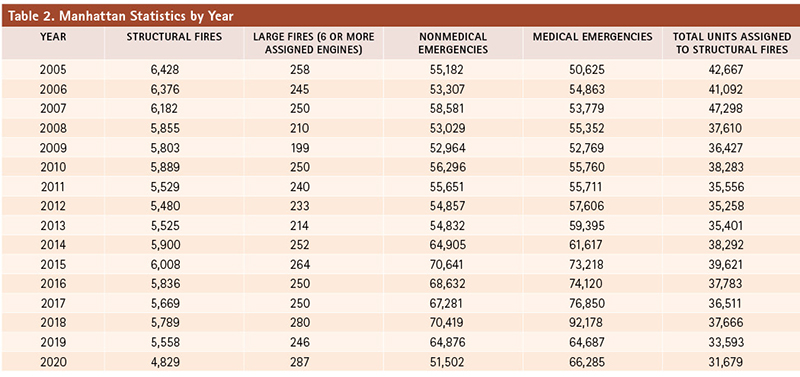
Each class of incident was counted by year and entered into an Excel table for each of the two boroughs. Additionally, annual total units assigned for structural fires were also entered into an Excel table for each borough. For each borough, a simple summary table of structural fires, large structural fires, medical emergencies, nonmedical emergencies, and total units assigned to structural fires was created.
Relationships between these factors were explored with bivariate regression and multivariate backward stepwise regression with Statgraphics v5.1 for Windows.
Results
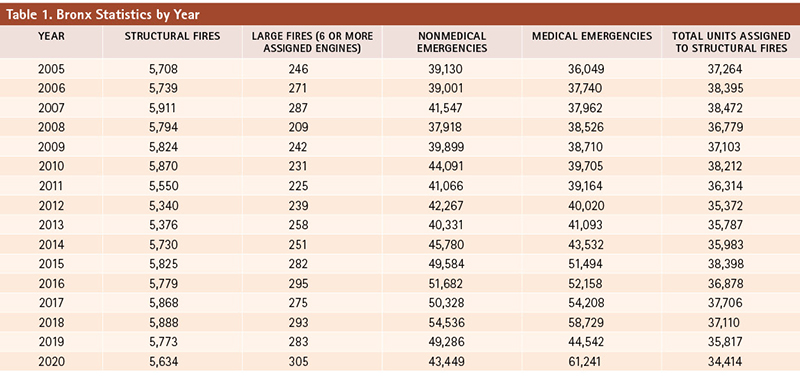
The number of large fires, nonmedical emergencies, and medical emergencies in the Bronx increased between 2005 and 2020, especially accelerating in 2015 (Table 1). Only the number of units assigned to structural fires decreased. Medical emergencies rose at a particularly striking rate, with the astonishing peak of roughly 61,000 in 2020: an increase of about 70 percent over 2005. Furthermore, during the six years of 2015 to 2020, only one year (2019) racked up fewer than 50,000 medical emergencies.
Large fires in the Bronx rose 24% between 2005 and 2020 and 46% between the 2008 absolute nadir and the 2020 absolute peak. Nonmedical emergencies rose 39% between 2005 (roughly 39,000) and peak year 2018 (roughly 55,000) with the 2019 and 2020 numbers remaining well above that of 2005. Total emergencies clocked in at 75,179 in 2005; at 113,265 in 2018 (rise of 51% from 2005); and at 104,690 in 2020 (rise of 39% from 2005). Units assigned to structural fires declined 8% from 2005 to 2020 and 11% from 2007 to 2020.
Large fires in Manhattan increased by 11% between 2005 and 2020, but the rise between 2009 and 2020 was 44%. Large fires declined between 2005 and 2009. Between 2005 and 2018, nonmedical emergencies rose 28%, but the rise between the 2009 nadir and the 2018 peak was 33%. The 2020 nonmedical emergency number was smaller than that of 2005. However, the medical emergencies remained higher in 2020 than 2005. The peak of 2018 was 82% higher than that of 2005. Total emergencies in Manhattan in 2005 were 105,807; in 2018 162,597 (54% higher than 2005); and in 2020 117,787 (11% higher than 2005). Units assigned to structural fires declined 26% between 2005 and 2020 and 33% between 2007 (peak) and 2020.
Over the 16 years, the number of structural fires was not related to the number of units assigned to the structural fires for either borough.
Bivariate regression of Bronx large fires with nonmedical emergencies yielded R-square of 0.35 (P=0.0098), positive association; with medical emergencies, R-square of 0.48 (P=0.0017), positive association; and with total emergencies, R-square of 0.46 (P=0.0023), positive association. In backward stepwise regression, medical emergencies swamped nonmedical. Bivariate regression of Manhattan large fires with nonmedical emergencies yielded R-square of 0.13 (P=0.0914), positive trend to association; with medical emergencies, R-square of 0.26 (P=0.0259), positive association; and with total emergencies, R-square of 0.23 (P=0.0329), positive association. Thus, for both boroughs, medical emergencies associated positively with large fires much more strongly than nonmedical emergencies. Adding the two types of emergencies only weakened the association, in comparison to only medical emergencies as the independent variable with large fires as the dependent. Furthermore, medical emergencies in the Bronx associated nearly twice as tightly with large fires than they did in Manhattan (R-square of 0.48 Bx vs. 0.26 Mn).
Figure 1a. Bronx Clusters
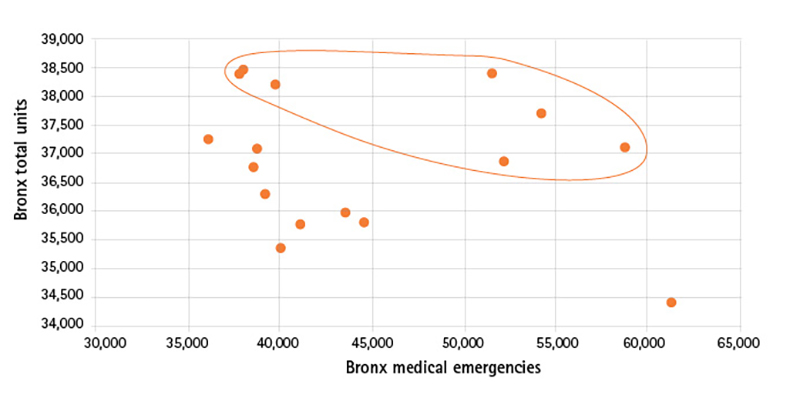
Annual Bronx total units graphed against annual Bronx medical emergencies, 2005 to 2020. Each data point represents a year. Note the two clusters of data points, one of which is circled.
Figure 1b. Manhattan Clusters
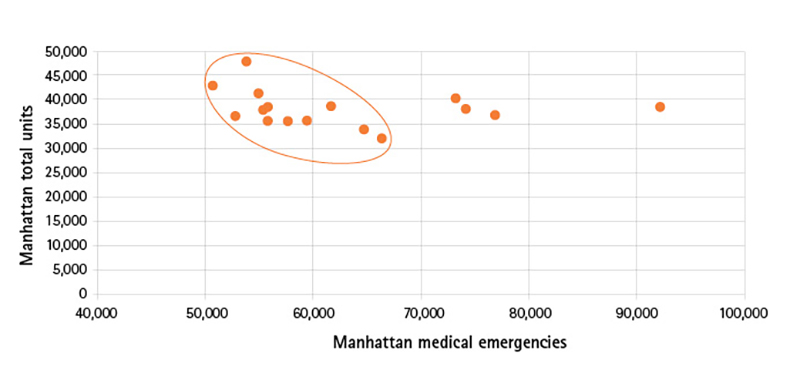
Annual Manhattan total units graphed against annual Manhattan medical emergencies, 2005 to 2020. Each data point represents a year. Note that only one cluster of data points appears, consisting of 12 of the 16 years.
Surprisingly, no association arises from bivariate regression between total units assigned annually to structural fires and annual medical emergencies for either the Bronx or Manhattan. However, when the data are graphed, separate clusters can be seen (Figure 1a for Bronx; Figure 1b for Manhattan).
In the Bronx, cluster 1 has seven data points and cluster 2, nine. Associations between assigned units and medical emergencies arise within these clusters: for cluster 1, R-square=0.46 (P=0.0557); for cluster 2, R-square=0.65 (P=0.0051). Both associations are negative.
Manhattan has a somewhat different picture. The major cluster includes 12 data points and has an R-square of 0.43 (P=0.0128, negative). The three data points in the other little cluster have an R-square of 0.71 but the very small number of data points make this high R-square not significant (P=0.25). One data point is an outlier.
The structural fire means, medians, and standard deviations of Bronx cluster 1 differ significantly from those of Bronx cluster 2: 5,840 vs. 5,636.6; 5,868 vs. 5,708; and 62.15 vs. 178.8, respectively. Total units assigned to structural fires also differ on average and median: 37,868.6 vs. 36,092.6 and 38,121 vs. 35,983, respectively. Medical emergencies do not differ significantly. These significant differences hint that the highs and lows of hyperendemicity parcel years into two different modes of operation with respect to servicing of structural fires.
Figure 2. Bronx Structural Fires by Year
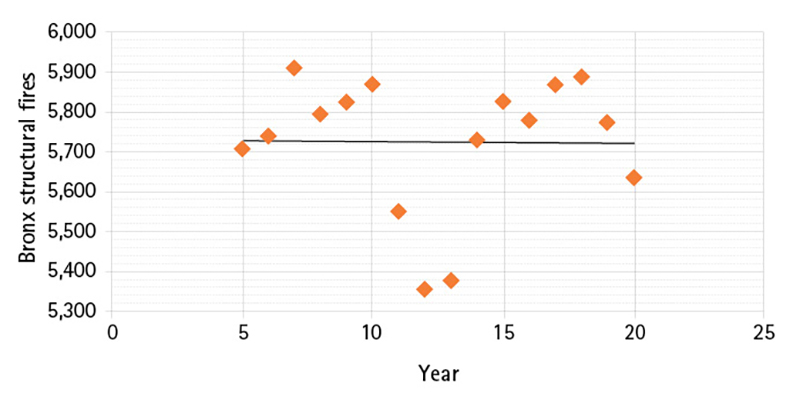
Total annual Bronx structural fires, by year. The trend line is essentially flat. The structural fires rise and fall in a wavelike pattern, a hallmark of hyperendemicity.
The relationships between medical emergencies and total assigned units for each Bronx cluster follow:
Total units of cluster 1=40,553.5-(0.056*medical emergencies) R-sq=0.46
Total units of cluster 2=40,348.9-(0.1*medical emergencies) R-sq=0.65
Neither cluster yields a significant association between number of structural fires and total units assigned to structural fires. Figure 2 displays annual number of structural fires plotted against year. The long-term trend over the 16 years is flat but the fires dip and surge in a wavelike pattern. This pattern of high flat temporal trend and wavelike ups and downs fulfills the epidemiologic definition of hyperendemicity.10
Because of the small number of data points in Manhattan cluster 2, comparison between clusters 1 and 2 is not statistically supportable. The relationship between total units assigned to structural fires and medical emergencies in cluster 1 follows:
Total Manhattan units=
73,174.8-(0.617*medical emergencies) R-sq=0.43.
Contrary to the Bronx, Manhattan structural fires of the main cluster of 12 years significantly associate with the number of units assigned to them: R-square=0.71. P=0.0004.
Assigned units =
-10,006.1+(8.265*structural fires) for the main cluster of 12 years.
In backward stepwise multivariate regression for the 12 years, the independent variable of structural fires swamps the other independent variable of medical emergencies in relation to the dependent variable of assigned units.
The number of assigned units for Manhattan’s structural fires in the four unusual years of 2015 to 2018 exceeds what would be expected from the equation predicting total units from the medical emergencies. This equation would predict the following total units for 2015, 2016, 2017, and 2018 respectively: 27,999; 27,443; 25,758; and 16,301.
Discussion
In the Bronx, over the 16 years of study, large fires associated positively with medical emergencies fairly strongly (R-square=0.48). However, when medical emergencies were regressed with total units assigned to structural fires, the relationship was not statistically significant. Graphing medical emergencies and total units showed two clusters of data points, one with seven years and the other with nine years. Within these clusters, medical emergencies associated significantly and negatively with total units assigned to structural fires with R-squares of 0.46 and 0.65, respectively. For the borough as a whole and for each cluster, the number of structural fires did not associate significantly with the number of units assigned to them. Thus, in the Bronx, one major determinant of assigned units is medical emergencies, which, in turn, associate with large fires. Previous studies have shown that the 1970s fire epidemic, triggered by the large cuts in fire service in poor neighborhoods of color, led to public health deterioration all the way to the present day.3,4,5 The Bronx was the hardest-hit borough.5,6,7
We hypothesize that the crisis in medical emergencies in the Bronx reflects its continuous public policy targeting and that what we have now is a vicious circle of large fires, public health and order deterioration, more large fires, and more public health and order deterioration. Because the Bronx suffers from hyperendemicity of structural fires, it is vulnerable to entering true epidemicity. The drain on unit availability from servicing enormous numbers of medical emergencies raises the probability of that shift, a type of shift that the great ecologist C.S. Holling called “regime change.” This takes place when the functioning of a system changes drastically because its components become too tightly linked and rigid to confer resilience against an impact.11 The combination of fire company cuts, reduced staffing, and far too much added nonfire workload threatens housing preservation and general fire safety, first in the Bronx and later in the entire city, if a fire epidemic spreads from the Bronx to other boroughs.
Manhattan’s system of annual large fires, medical emergencies, units assigned to structural fires, and number of structural fires differs greatly from that of the Bronx. Although the relationship between large fires and medical emergencies is significant and positive, it is weaker than that in the Bronx. Although the bivariate regression of medical emergencies and total units assigned to structural fires is also not significant, Manhattan has a major cluster of data points in the graph of medical emergencies graphed against total units that covers three-quarters of the 16 years of study: 12 years. The relationship of medical emergencies and units within that cluster is significant but not as strong as that of the major cluster in the Bronx (R-square of 0.43 as opposed to 0.65 in the Bronx). Furthermore, within this cluster of 12 years, the number of structural fires significantly and positively associates with the total units assigned to structural fires, unlike the situation in the Bronx where these two variables had no association in either of the two clusters. Indeed, this association has an R-square greater than that of any other significant association in this study, 0.71.
The four years that do not fall within the major cluster feature greater numbers of medical emergencies than those within the major cluster, well over 70,000. It appears that annual structural fires in Manhattan receive proportionate assigned units if the annual number of medical emergencies does not exceed 70,000. Thus, the relationship between large fires and medical emergencies in Manhattan is weaker than that in the Bronx, where medical emergencies ranged from a rounded 36,000 to 61,000 during the 16 years of study. However, the mere fact of an association in Manhattan with an R-square of 0.26 indicates vulnerability to greater future influence of medical emergencies on the ability to control structural fires and keep them small via an adequate number of assigned units. The number of structural fires declined in Manhattan over the study period, but the number of large structural fires increased—a sure sign of this vulnerability.
Manhattan’s situation may have been saved by the shift to work-from-home arrangements and by the upper- class emigration during the early days of the COVID-19 pandemic. Before the pandemic and the shift to work-from-home, the population of Manhattan just about doubled on workdays, with commuters from other counties.12 The number of commuters has plummeted now. The reduction in commuters means fewer potential sources of medical emergencies. Furthermore, assigned units for the years of more than 70,000 medical emergencies greatly exceeded those expected from the relationship between units and medical emergencies of the 12 clustered years. The dispatchers may have protected Manhattan buildings by assigning units to structural fires at a rate much greater than those assigned in the Bronx—and much greater than those assigned during the clustered 12 years. The geography of structural fires, assigned units, large fires, and medical emergencies should be explored in future research so both boroughs can fully understand the dynamics over these 16 years.
In contrast to Manhattan, the major employers in the Bronx are health care providers and social assistance organizations.13 Furthermore, the largest industry is the Hunts Point Food Center, where about 80 percent of all the food consumed in New York City is received and redistributed to groceries and restaurants.13 Food processing also occurs at Hunts Point. The percentage of the Bronx’s workforce that can work from home is miniscule compared with that of Manhattan. There is little or no shaving of potential sources of medical emergencies. On the contrary, the Bronx continues to be the unhealthiest county of New York State, a driving force for medical emergencies.
Conclusion
Since 2005, Bronx medical emergencies to which fire companies respond have exceeded 36,000 per year, with all but one year between 2015 and 2020 registering more than 50,000 such responses. Over the 2005 to 2020 period, structural fires in the Bronx did not decline. Medical emergencies appear to thin the number of units assigned to structural fires in the Bronx and thereby inflate the number of large fires. The Bronx seems caught in a vicious circle of large fires that damage homes, leading to public health erosion, which leads to more medical emergencies, which inflate the number of large fires.
The situation in Manhattan differs from that of the Bronx. Structural fires declined in Manhattan between 2005 and 2020, and for most years of the study, the number of firefighting units assigned to structural fires was not so decimated by medical emergencies that the number of units did not even associate with the number of structural fires. However, those four years in which medical emergencies exceeded 70,000 showed unusually elevated numbers of units assigned to structural fires, a sign of possible protective policy for Manhattan but not for the Bronx. If the system in Manhattan operated for the four “outlying” years as it did for the cluster of 12 years, the number of units assigned to structural fires would have been 27,999 (2015), 27,443 (2016), 25,758 (2017), and 16,301 (2018). The actual assigned units were 39,621 (2015), 37,783 (2016), 36,511 (2017), and 37,666 (2018).
The annual number of large fires in Manhattan significantly associated positively with the annual number of medical emergencies, albeit less tightly than the association in the Bronx. Thus, Manhattan is vulnerable to straining of firefighting resources by large numbers of medical emergencies.
The policy decision to send firefighting units to medical emergencies never received a proper impact assessment. Indeed, the decision in the 1970s to cut fire companies and the staffing of the remaining companies never received proper impact assessment, although impact assessment science was in full flower then. Repairing the ability of the FDNY to keep structural fires small requires rethinking fire unit workload.
This study has limitations. We assume that the great majority of the database was entered correctly, although we have seen some problems, such as the 1% to 3% of the entries in each classification of incident that was not geocoded below the borough level and the 1 or 2 entries of incorrect borough. Furthermore, only 16 years provide data points. When we divided these 16 years into even smaller clusters, each analysis had a very low number of data points. The power to detect significant associations and differences in mean, median, and standard deviation tapers with tapering of number. Thus, the significant results represent strong patterns. Less tight associations, which may influence the number of large fires or number of total units assigned to structural fires, may go undetected because of lack of power. However, the fundamental results and their interpretation remain largely sound.
When we analyzed the data from the FDNY open-access Web site, the database had been last updated in April 2022, with 2020 as the latest full year. The database was most recently updated in July 2023. If the database now contains later full years, we shall further examine the development of the systems that we explored herein.
Authors’ note: Special thanks to Associate Professor Charles Jennings, director of the Christian Regenhard Center for Emergency Response Studies, and the Center’s data manager/analyst Ian Morlean, of Arborlook Insights LLC, for sending us the Bronx and Manhattan sections of the FDNY open-access database.
ENDNOTES
1. Canadian Broadcasting Corporation. 2016, accessed August 1, 2023, bit.ly/3NQ8AQR.
2. Wallace R., Wallace D., Studies on the Collapse of Fire Service in New York City 1972-1976: The Impact of Pseudoscience in Public Policy. Washington DC: University Press of America, 1977.
3. Wallace R., Wallace D., “Origins of public health collapse in New York City: the dynamics of planned shrinkage, contagious urban decay, and social disintegration,” Bulletin of the New York Academy of Medicine Volume 66, pp.391-434, 1990.
4. Wallace D., Wallace R., A Plague on Your Houses: How New York Was Burned Down and National Public Health Crumbled. London and New York: Verso Books, 2001.
5. Wallace D., Wallace R. COVID-19 in New York City: An Ecology of Race and Class Oppression, Springer Briefs in Public Health, Springer Cham, Switzerland, 2021.
6. Wallace D., Wallace R., “Public Policy as Hate Crime, Part 1,” Bronx Historical Society, 2023, youtu.be/wCLeNcPHNsA.
7. Wallace D., Wallace R. “Public Policy as Hate Crime, Part 2,” Bronx Historical Society, 2023, youtu.be/W5zPbwRBNgA.
8. “Putnam Ranked New York’s Healthiest County, Bronx Comes in Last,” CBS News, March 29, 2023, cbsn.ws/4aESjYx.
9. QuickFacts for Bronx and Manhattan, U.S. Census Bureau, 2023.
10. Sinnecker, H., General Epidemiolgy, New York: John Wiley & Sons, 1971.
11. Holling, C.S., “Resilience and Stability of Ecological Systems,” Annual Review of Ecology and Systematics, Volume 4, pp.1-23, November 1973.
12. “The Ins and Outs of NYC Commuting: An Examination of Recent Trends and Characteristics of Commuter Exchanges between NYC and the Surrounding Metro Region,” NYC Planning Department, September 2019, on.nyc.gov/4aLi9Ko.
13. “An Economic Snapshot of the Bronx,” Office of the New York State Comptroller, 2018, osc.ny.gov/reports.
RODRICK WALLACE has an undergraduate degree in mathematics and a Ph.D. in chemical physics. He has studied the cuts in New York City fire service in the 1970s for almost half a century as well as other urban system processes. He has been a research scientist in the Division of Epidemiology at the NYS Psychiatric Institute since 1987.
DEBORAH WALLACE has a Ph.D. in ecology and, as a manager of biological studies for the electric utilities in the 1970s-early 1980s, was among the pioneers of environmental impact assessment. She also has studied the cuts in NYC fire service in the 1970s and their immediate and long-term consequences as well as other urban processes. She is now retired after a 44-year career. She remains an active analyst of complex systems.

