By TRACY WHELEN
Historically, partnerships between fire departments and local universities and colleges have focused on educational opportunities for firefighters, “live-in” programs for fire science students, and other programs focused on recruitment and retention. In recent years, partnerships have been expanded to help local fire agencies better use and interpret the mountains of data they collect. For example, the Houston (TX) Fire Department highlighted its partnership with Rice University in the April 2020 issue of Fire Engineering, which provided the fire department with custom advanced data analytics to optimize fleet placement and maintenance to improve the longevity of its fire apparatus. The project benefited the students and university by providing meaningful, real-world problems the students could apply their newly learned skills to help solve.1
- Advantages of Fire Department-University Partnerships
- Using Big Data Analytics to Enhance Fire Response Capability
- Big Data Driving Operational Performance and Fireground Safety
- Risk Assessment: It Is Personal
The Columbia-Richland (SC) Fire Department (CRFD) used a similar model to develop a novel geographic information system (GIS)-based risk assessment to support its efforts to pursue international accreditation status. Given the proximity to the University of South Carolina (UofSC), CRFD often has a few current students as volunteer firefighters as well as some other ad-hoc interactions over the years. In 2018, I started a master’s degree in geography at UofSC and joined CRFD as a volunteer firefighter, having previously been a call firefighter/emergency medical technician outside the region. The CRFD’s volunteer coordinator, Battalion Chief William Broscious, asked if I could use my GIS skills to develop a risk assessment for the fire department as it aligned with the organizational accreditation initiative; this risk assessment became my master’s thesis.2 This article explains the techniques and findings of that risk assessment as an example of how partnerships with local universities and outside skills brought by volunteer firefighters can be used to benefit the fire service.
The Columbia-Richland Fire Department
The CRFD serves 388,000 people in Richland County, South Carolina, covering 683 square miles. The center of the county around the city of Columbia is urbanized, with population density decreasing toward the county boundaries through suburban and rural areas. Approximately 500 career firefighters and 120 volunteers staff 32 fire stations organized into five battalions.
The stations within the Columbia city limits are staffed entirely by career personnel, with the remaining stations staffed by a combination of career and volunteer firefighters. All but one station has a fire engine, with specialized units (i.e., ladder trucks, rescue trucks, tankers, and so on) scattered across the county. Ambulance service is provided by Richland County EMS, with CRFD responding to potentially time-critical emergency medical services (EMS) incidents as first responders.
History of Risk Assessments
The three core questions when assessing risk are the following:
- What types of hazards are under consideration?
- What factors increase risk for this type of hazard?
- Who or what is threatened by this hazard?
Often in the fire service, fire risk is thought of as being based on physical risk factors such as the distance to the first-due apparatus or building construction components. Reports on fire fatalities often include demographic characteristics such as age or race, but this information doesn’t necessarily get included in formal risk assessments, even though demographic and socioeconomic risk factors are common topics in the public health and hazards fields. This risk assessment used a combination of physical, demographic, and socioeconomic risk factors.
Risk is inherently spatial because hazards, people, and items at risk change from location to location. There is a long tradition of using spatial data to assess fire risk, first through paper maps and, more recently, GIS and other computer-based spatial modeling tools. Fire insurance maps showing individual buildings labeled with building construction and occupancy information were common in the late 19th and early 20th centuries.3 These maps were expensive to make and rapidly fell out of date, especially in rapidly growing regions.
In the mid-20th century, computers began to allow for more complex mathematical and statistical modeling based on actuarial and road network data.4 These coverage assessments focused on minimizing first-due response times and defined risk primarily around distance to the nearest fire station, ignoring most other potential risk factors. The classic example is the Fire Department of New York’s work with the RAND Corporation in the 1970s.5,6
Since the mid-20th century, the U.S. Fire Administration and public health organizations have also produced many reports on fire victim demographics and socioeconomic traits (age, race, gender, poverty, and so on).7 More recently, these reports have been turned into vulnerability assessments by combining them with census data and geocoded fire incidents to predict what neighborhoods might be at higher fire risk. Liverpool and Cardiff in the United Kingdom are two communities to have this kind of risk assessment.8,9
Using GIS to Identify Risk
GIS is a great tool to use for risk assessments because it enables robust analysis of many spatial data layers related to risk such as combining U.S. Census data (demographic and socioeconomic risk factors) with physical risk factors like building age and construction, railroad-grade crossings that can slow responding units, and fire station location. Risk factors alone or in combination can be compared with incident locations, helping to identify which risk factors are most important for a particular neighborhood.
Many commercial software packages allow spatial data to be visualized, and this kind of simple map is a useful starting point. However, only a handful of systems (e.g., ArcGIS, QGIS) allow for more complex spatial analysis, particularly spatial statistics. This is important because the core tenet of geography—“near” things are more closely related than “far” things—means that spatial data immediately breaks the assumption of independence that’s required for most nonspatial statistics. Spatial analysis in a robust risk assessment requires more than mapping individual risk variables side by side.
This risk assessment used four GIS and statistical techniques (hot spot analysis, factor analysis, correlation analysis, and cluster analysis) to do two things: first, assess the distribution of structure fires, emergency medical incidents, and carbon monoxide (CO) incidents, comprising, in total, about 10,000 incidents per year during the 2012-2018 analysis period; second, examine the relationship between risk factors and incident occurrence.
Since many risk variables were from the U.S. Census, analysis was done using census block groups as proxies for neighborhoods. Results highlighted which risk factors are most important for specific neighborhoods with high incident rates.
Incident Hot Spots
Most experienced firefighters can tell you what neighborhoods in their territory are the busiest for incidents. However, do you know which neighborhoods in your region are busier than average for their population, rather than which ones are busy because they have a large, dense population?
Hot spot analysis can tease these questions apart. This technique compares each neighborhood with the neighborhoods around it and identifies which clusters of neighborhoods are hot spots—i.e., have higher incident rates than would be expected for that size population. Likewise, it identifies cold spots—the corresponding areas with lower-than-expected incident rates—as well as standalone high and low incident rate outliers.
Hot spot analysis allows us to gain two insights based on the data. First, we can confirm or deny anecdotal statements from line firefighters about which areas are the busiest. Second, we can identify unrecognized areas with higher-than-expected incident rates. Identification of key areas with high incident rates is important because these areas use fire service resources at an above-average rate and could benefit the most from prevention activities. Hot spot analysis works best on relatively common incidents (or all incidents combined), where every neighborhood has one or more instances of the incident type. It does not work well with rare incident types like fire fatalities, where many neighborhoods haven’t suffered this type of incident within the analysis time frame.
Think about the types of calls to which your station responds most frequently. Maybe it’s medical calls; hot spot analysis could help support the need for and best placement of a community paramedicine program to intervene with high-volume service users, repeatedly calling for non-emergent medical issues. If you spend all day responding to malfunctioning fire alarms, this type of data could pinpoint commercial districts needing alarm maintenance code enforcement or residential neighborhoods to target in a public education campaign about testing and replacing batteries in smoke detectors, or it could show that your response area is busy because of a large population rather than an above-average incident rate.
In the case of Columbia, hot spot analysis worked great when looking at structure fires and medical calls, identifying hot spots that aligned with department anecdotal evidence and were visible in thematic maps of incident rates. For structure fires, one big hot spot was identified on the northern edge of the city (Figures 1, 2). EMS had a similarly located large hot spot, with another smaller hot spot in the southeastern part of the county.
Figure 1. Hot Spot Analysis for All Structure Fires
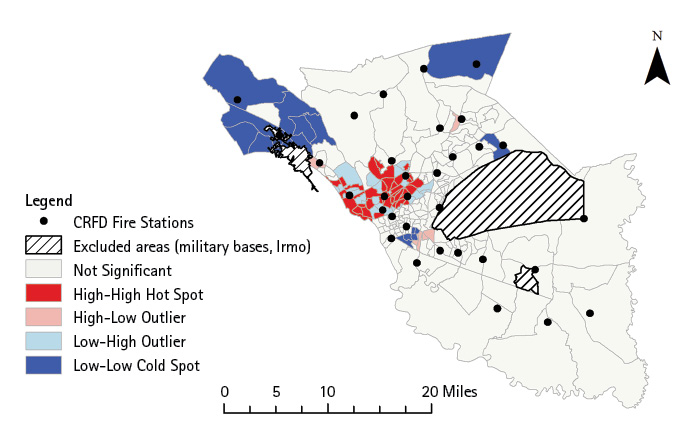
Note the hot spot in the middle of the map—the northern part of Columbia—and compare it with the incident rates for individual neighborhoods in Figure 2.
Figure 2. Structure Fire Incident Rate
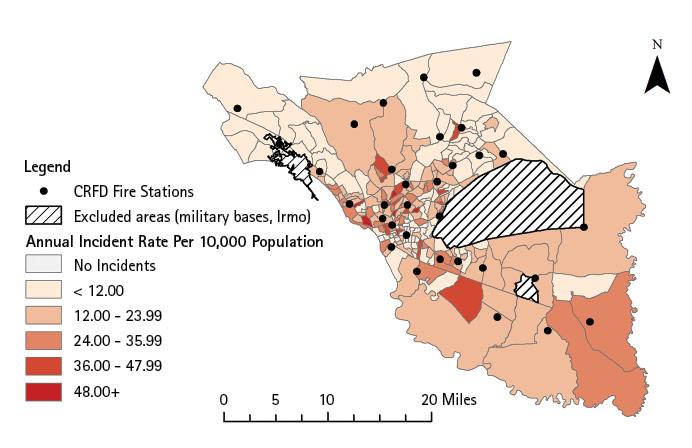
Note how some neighborhoods have more than four times the number of structure fires per person than other neighborhoods and how many of these high incident rate neighborhoods align with the hot spot in Figure 1.
Grouping Risk Factors
Sometimes, risk factors come in groups, where two or more risk factors are similarly distributed throughout a community. For example, communities with lower education often have lower incomes; a statistical technique known as “factor analysis” can identify these groups. Each group or principle factor is built from risk factors that share similar patterns—“positive loadings”—whereas risk factors with opposing patterns are known as “negative loadings.” This technique helps identify high-risk communities more effectively than just looking at single risk factors. Marketing companies use similar methods when they segment customers into personas (e.g., Esri Tapestry Segmentation, Experian Mosaic).
The CRFD risk assessment identified nine principle factors (Table 1) derived from 31 original risk variables. We can see that, in some communities, risk is primarily related to demographic and socioeconomic risk factors (Factors 1, 5, 8), whereas in other communities, physical risk factors (Factor 3) or a combination of risk factors are more influential. One neighborhood’s risk can be influenced by multiple principle factors, just like it could be influenced by multiple individual risk variables. This shows us that targeted prevention activities may need a many-pronged approach.
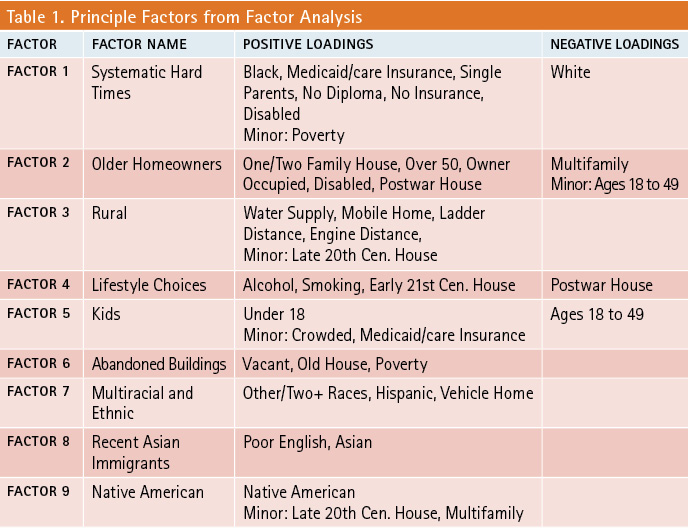
We can look at two factors, Factor 1 (Systematic Hard Times) and Factor 3 (Rural), as case studies into tailoring fire service activities to best meet the needs of specific communities. With Factor 1, we see that fire safety education could be targeted to two key audiences: kids (and their caregivers) who might have limited supervision and adults with disabilities and thus potentially mobility issues. Likewise, in an area with lower high school graduation rates, it is important to ensure fire safety messaging uses easily understood images and language so that all members of the community can grasp the important takeaways. In contrast, Factor 3 shows mostly physical factors that could be addressed by a combination of fire safety education and department preplanning. Education activities could focus on safety for mobile home residents, whereas department preplanning could focus on best practices for response in an area with no hydrants and longer response times.
Correlation Between Risk Factors and Incidents
Sometimes, the broad, overall patterns between risk factors and incidents can be a useful starting place to validate one’s assumptions before diving deep into the data. Correlation analysis describes the relationship between two variables, such as a risk factor and incident type, in terms of the relations being positive or negative and the strength of the relationship. A positive correlation means that, as one variable increases, so does the other. For example, for an increase in the risk factor corresponding to an increase in incidents, correlation strength refers to how tightly related the two variables are. This type of analysis can be helpful to identify which risk factors are related to specific incident types.
One downside is that, as a nonspatial technique, it looks at overall relationships for your entire area and cannot distinguish between neighborhoods. This means that a risk factor that is only important in some, but not all, neighborhoods will not be properly understood.
In the CRFD risk assessment, there were many risk factors that had statistically significant correlation with one or more incident types, but the strength of these correlations was weak to moderate. This means that risk is complex, and no single risk variable (or group of risk variables—i.e., principle factor) explains all risk. Although this may be obvious to firefighters because no two incidents are identical, this isn’t always obvious to elected officials and community members. Correlation data showing many risk factors are equally important and can be useful when advocating for increases in fire department resources or as a counter statement if being pressed by local officials to name the one or two most important risk factors for an entire city or county.
Matching Risk Factors with Neighborhoods: The Numbers
Where correlation analysis was only helpful in painting the broadest brush strokes, cluster analysis was extremely helpful in putting a name and a face to each neighborhood in terms of key risk factors and patterns of incidents. Cluster analysis based on principle risk factors grouped together nonadjacent neighborhoods based on shared patterns of risk factors. Fourteen groupings were identified, which, when compared with additional demographic information, were able to be labeled as communities such as college students, correctional institutions, suburban families, and commercial districts.
It was enlightening to compare the average incident rates for each of these 14 groups against each other as well as the countywide average. Half the groups had either consistently higher or lower than average incident rates, whereas the other half of the groups had a mix, with some incident types much higher than the county average and other incident types occurring at a lower-than-average rate.
Group 2, with high rates of the Systematic Hard Times factor and near the main hot spot of incidents, had consistently high incident rates. Systematic Hard Times is the factor previously identified as potentially benefiting from a two-pronged fire safety education approach focused on kids with limited supervision and adults with disabilities. Group 5 (suburban households headed by married couples) had consistently average rates.
Groups with consistently lower-than-average rates (Groups 1, 3, 4, 8, and 11) had a mix of identities including neighborhoods with many university student apartment complexes (Group 4), institutions (Groups 8 and 11), semirural areas (Group 1), and a rapidly growing area with many young families (Group 3). Group 4, with large student apartment complexes and nearby fire stations, would need different response strategies than the single-family homes and more widely spaced semi-rural areas of Group 1.
For the half of the groups with a mix of high and low incident rates, each area had a unique combination of incident rates and risk factors. For example, Group 6 was notable for high fire injury and CO incident rates with a primary risk factor related to poor English ability, suggesting a need for multilingual fire and CO safety education. Group 7 had generally average rates, except for fire fatalities (high) and CO rates (low), with the multiracial and ethnic factors as the only notable risk factors. Group 9 is a heavily commercial area, with the high rate of EMS and no casualty fire calls combined with zero fire casualties, suggesting a larger daytime nonresidential population not accounted for in U.S. Census data. Groups 10 and 13 are primarily rural, with higher fire and EMS rates and minimal CO incidents. The small populations in these areas mean that a single fire fatality (Group 13) made for a higher-than-average fire fatality rate compared to Group 10’s lack of fatalities. Group 12, with many young single adults generally having slightly above average incident rates but few fire injuries and no fatalities, suggests a population can more easily escape a fire without injuries. Finally, Group 14, primarily white and well-educated neighborhoods, were notable for the highest CO rates, in contrast to most other incident types being near average.
The key takeaway from cluster analysis is that it is important to know your department’s population, as a one-size-fits-all approach to prevention and response is probably not the most effective policy. To tailor your fire department activities to meet your neighborhood’s needs, you first need to know your neighborhoods.
Neighborhood vs. Battalion
The project described multiple ways to group neighborhoods, using either hot spot analysis to group neighborhoods by incident rate or cluster analysis to group neighborhoods based on shared patterns of risk. An important thing to note is that neither of these aligned with battalion boundaries. In fact, assessing incidents at the battalion level split the main fire and EMS hot spots between two battalions while combining multiple smaller hot spots of fire fatalities within a single battalion (Figures 3, 4). Assessing performance by battalion provides finer detail than assessing a large department as a whole. However, only assessing data at the battalion level can still cloud smaller spatial patterns.
Figure 3. Comparison Between Battalion Boundaries and the Main EMS and Fire Incident Hot Spot
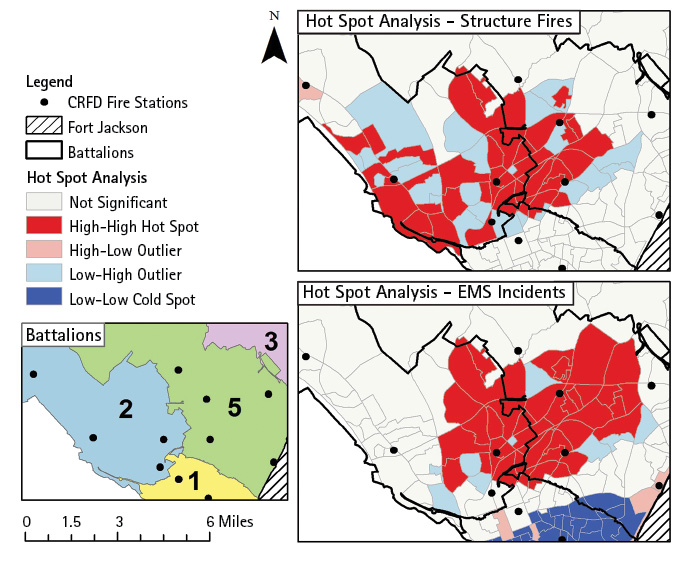
Note that the main hot spots overlap two battalions.
Figure 4. Comparison of Fire Fatality Locations Within and Near Battalion 5
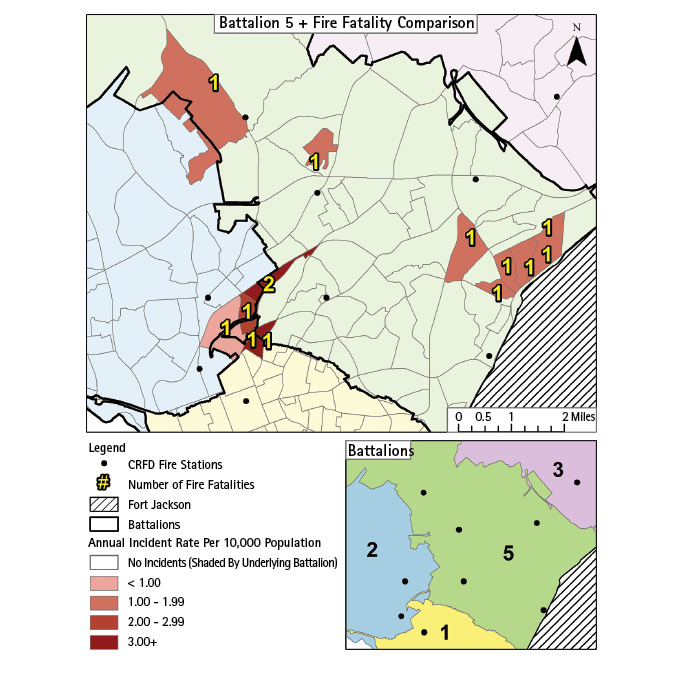
Battalion 5 has the highest fire fatality rates. Note that Battalion 5 contains two smaller clusters of fire fatalities, one of which is split between the boundaries of three different battalions.
Lessons Learned
This risk assessment provided specific details to the CRFD, but it also offers a framework and four key lessons for any department to use in the future.
- Know your response area. Neighborhoods vary, even within a single station’s response area. A one-size-fits-all approach is not the most effective form of community risk reduction, and local response knowledge needs to be continually refreshed and passed on to new department members.
- Data can be valuable in supporting or disproving anecdotal evidence from firefighters and officers as to the busiest neighborhoods or what risk trends are seen in a given area.
- Spatial data and GIS techniques provide greater depth and insights than purely tabular data or nonspatial statistics. Nonspatial techniques (correlation analysis, factor analysis) provided some insights, but it was the spatial methods (hot spot and cluster analyses) that truly brought the area to life.
- Be aware of the resources and technical expertise that local colleges and universities can provide. Emergency management and public administration departments can be obvious partners, but other academic departments such as geography, data science, and statistics can provide technical expertise as well, with partnerships benefiting all parties.
These takeaways—knowing your neighborhoods as individual communities; building mutually beneficial partnerships with local universities; and the value of data, especially spatial data and spatial analysis techniques—can benefit any department doing a risk assessment.
References
1. Chan LN, S Perry, and A Steinberg. 2020. “Advantages of Fire Department – University Partnerships.” Fire Engineering, April 2020.
2. Whelen, T. 2020. “A GIS-Based Risk Assessment for Fire Departments: Case Study of Richland County, SC.” Master’s Thesis, Columbia, SC: University of South Carolina.
3. Oswald D. 1997. Fire Insurance Maps: Their History and Applications. College Station, Texas: Lacewing Press.
4. Tebeau M. 2003. Eating Smoke. Baltimore, MD: The Johns Hopkins University Press.
5. Flood J. 2010. The Fires: How a Computer Formula Burned down New York City – and Determined the Future of American Cities. New York, NY: Riverhead Books.
6. Green LV and PJ Kolesar. 2004. “Anniversary Article: Improving Emergency Responsiveness with Management Science.” Management Science 50 (8): 1001–14. https://doi.org/10.1287/mnsc.1040.0253.
7. Federal Emergency Management Agency, United States Fire Administration, National Fire Data Center. 1997. “Socioeconomic Factors and the Incidence of Fire.” Governmental FA 170. Emmitsburg, MD: Federal Emergency Management Agency, United States Fire Administration, National Fire Data Center. https://www.usfa.fema.gov/downloads/pdf/statistics/socio.pdf.
8. Higgins E, M Taylor, M Jones, and PJG Lisboa. 2013. “Understanding Community Fire Risk—A Spatial Model for Targeting Fire Prevention Activities.” Fire Safety Journal 62 (November): 20–29. https://doi.org/10.1016/j.firesaf.2013.02.006.
9. Taylor MJ, E Higgins, M Francis, and P Lisboa. 2011. “Managing Unintentional Dwelling Fire Risk.” Journal of Risk Research 14 (10): 1207–18. https://doi.org/10.1080/13669877.2011.587884.
TRACY WHELEN is a volunteer firefighter with the Windsor Locks (CT) Fire Department and an emergency medical technician with the Suffield (CT) Volunteer Ambulance Association. She has bachelor’s and master’s degrees in geography from Mount Holyoke College and the University of South Carolina. Whelen previously served with the Columbia-Richland (SC) Fire Department and South Hadley (MA) Fire District #2.

