BY DWIGHT GOOD
When I started this project, my agency was in the enviable position of trying to decide where to place a few extra firefighters every day. We had enough funding to add two or three people per shift. With 22 stations, it was difficult deciding where those extra bodies would do us the most good.
I began by checking to see what others in the industry had done. What I found was a lot of debate and no consensus or guidelines. In the absence of industry standards, I set sail on uncharted seas. I had to build a decision matrix that could be used to prioritize staffing decisions. Decisions needed to come from a process that was clearly articulated and scientifically sound.
A very nonscientific questionnaire sent to 200 other agencies brought up some of the more unpleasant stuff that this industry is dealing with these days. Fire departments were twice as likely to have a decision matrix in place for staffing decreases as for staffing increases. Those willing to share indicated that the decision process used for staffing decreases more closely resembled a form of political cage fighting than anything else. From here, it was obvious that whatever solution I came up with should probably work backward as well as it did forward. Many fire chiefs are facing the problem of figuring out where losing one firefighter will have the least impact on their operations.
The simplest explanation of a decision matrix would be that it is a grid where important elements are identified and given a weighted score. Tally the scores and, presto, your options are prioritized based on predetermined criteria. I do not intend to engage in the debate over what appropriate staffing levels are. That was not the purpose of this project. Suffice it to say that the agency I work for is a moderately sized, modestly busy county fire department that still relies on volunteer firefighters to flesh out our responses. We are not overstaffed by any stretch of the imagination.
I incorporated risk indicators and risk predictors that had been previously validated by scientific study and accepted by the fire service industry. They were then blended with the loose industry consensus standards discovered during research and deemed applicable.
I had to figure out what was important, and how important. The options were numerous and included the following:
- a risk assessment,
- the internal fire department analysis associated with accreditation,
- a study of socioeconomic risk indicators,
- call volume,
- response times,
- demand zones and response area overlap,
- volunteer response rates,
- a review of our own Standards of Response Cover,
- workload indicators such as time to complete certain tasks or time committed to certain tasks,
- an evaluation of firefighter and civilian fire injury and fatality rates,
- fire loss statistics,
- apparatus utilization rates,
- asset valuations,
- simultaneous calls for service, and
- external political pressure.
RISK ASSESSMENT, RANTS AND RAVES
How much weight should a risk assessment carry in the staffing decision? I think it’s worth a lot, and I’m not happy that the U.S. Fire Administration dropped the Risk, Hazard and Value Evaluation (RHAVE) program. RHAVE was designed as an evaluative tool that could be used for an indexed risk exposure comparison and as a reference for decision making in the fire service. The program has not been supported or updated since 2001, and it doesn’t work in modern operating systems.
The Center for Public Safety Excellence is working on a more “comprehensive and scientifically valid” risk assessment package, but it hasn’t offered any projected release dates. To further aggravate the issue, RHAVE is still listed as a viable risk analysis tool in the latest edition of the International City/County Management Association’s publication Managing Fire and Rescue Services. That means a few poor fire chiefs are getting their ears boxed because they can’t use an obsolete software program.
Our friends across the pond have developed a brilliant program called the Fire Service Emergency Cover (FSEC) Toolkit. The FSEC is a GIS-based risk assessment program that calculates fire department response times and outcomes. Census data are imbedded to reflect socioeconomic conditions and population density. Historical fire data are also included to ensure the reliability of projected scenario outcomes and to produce “risk maps.” Information about the “built environment” is obtained from local prefire plans.
The FSEC Toolkit can be used to evaluate the effects of various strategic proposals including changes to station locations, apparatus response plans, and staffing levels at little cost and without risk to the community. This program appears to have picked up where RHAVE left off, using many of the same risk assessment variables. The FSEC also allows the user to run simulated incidents and calculate the costs, risks, and benefits of any proposed changes. I contacted the FSEC help desk for a copy of the program—aside from the licensing issues, it pointed out that the imbedded GIS data are relevant only to the United Kingdom. I can only hope that our next-generation risk assessment software package is as advanced.
The rights to RHAVE were sold to the company Emergency Reporting a few years ago. The name was changed to VISION, and a price tag was added to what once was a free software package.
I did manage to get my hands on an Excel-based version of RHAVE from an instructor at the National Fire Academy. It was clumsy but functional. I used it to conduct risk assessments in a 21⁄2-mile radius around each of our stations. By plotting incident locations on a map, I was able to confirm that almost 90 percent of our responses are within 21⁄2 miles of a fire station. Assessed valuations balanced things out—not all risks and hazard exposures show up in prefire plans.
SOCIOECONOMIC RISK INDICATORS
The second variable added to my decision matrix was the socioeconomic aspect of each response area. Research here and abroad has confirmed the validity of socioeconomic risk indicators. Even though everyone probably has not read the Federal Emergency Management Agency’s Socioeconomic Factors and the Incidence of Fire, most veteran firefighters know that unattended children start fires, that we have more problems in poorer neighborhoods, that high unemployment rates lead to increased call volume, and that undereducated people are more likely to need our help. These are just good predictors of the demand for services we can expect in the communities we serve.
For this project, I used the four strongest socioeconomic variables identified in that report to create a measure of need and population figures to weight the total risk. The risk indicators included were parental presence, poverty, unemployment, and undereducation. I collected information from the U.S. Census Bureau American Fact Finder Sheets for each station’s zip code area. Even when comparing 10-year-old socioeconomic risk indicators with current incident data, the connections were indisputable. I have since discovered that the U.S. Census Bureau breaks this socioeconomic information down by census tract. It’s a little more work to extract the information, but it should result in a much more precise evaluation. I’m waiting for the 2010 Census data to revisit this portion of my project.
INCIDENT STATISTICS
Quite a few departments base decisions like this on call volume or average response times. It seemed that the issue of response deserved a little more attention than that, so I tried to produce a value for the speed and weight of attack. Some of our response areas are very large, and there is a considerable amount of variation in the time needed to see a full first-alarm response at scene. In broad generalities, the more quickly we can arrive, the less help we will need.
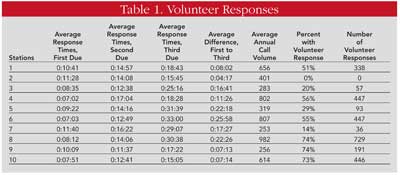
I settled for an analysis and comparison of the speed and weight of attack we could reasonably expect from each station. The questions were (1) how long does it take for the first unit to arrive, (2) how long does it take to get additional units to the scene, (3) how large is the supplemental personnel response, and (4) how often does it all happen?
I struggled to quantify the value of one additional firefighter on an engine. The consensus from time trial studies suggests that an additional firefighter improves the performance of an engine company by about 30 percent, but I was unable to assign a definitive value to this enhanced performance capability.
The International City/County Management Association recommends that staffing decisions be considered, in part, on response distance and workload. The third question was a study of the average number of volunteer firefighters who responded and the percentage of calls to which volunteers responded. Both measures were important. If many hands make the work seem easy, then the opposite should apply as well. The frequency of occurrence (call volume) was used to weight the values of the other factors. (See Table 1.)
APPARATUS UTILIZATION
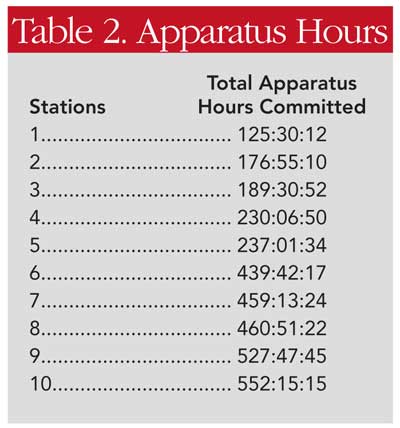
Another generality that applies here is that all incidents are not created equal. The average number of apparatus hours committed to incidents within each response area was determined using incident report statistics. The average apparatus utilization rates are a good indication of workload and are more reliable than special projects. All hours that all apparatus were committed to incidents in each response area were counted, and the benefits of mutual-aid agreements were effectively measured by not counting the hours that outside resources were committed. The issue of simultaneous calls for service was not evaluated on its own because we always send the closest available unit. Apparatus utilization rates made it into the matrix. (See Table 2.)
As any veteran of the fire service can attest, not all calls are created equal. The following examples are oversimplified but do demonstrate the concepts well. Station numbers in all examples have been changed to protect the innocent.
Station 1 may serve an older, sicker population and run a lot of medical-aid calls. The average commit time on a medical-aid call is about 10 minutes. Based purely on call volume, a station that runs six of those a day may look pretty busy, but the total commitment time was still only about an hour.
Station 2 may handle a lot of nuisance fires—maybe two or three a day. Nuisance fires don’t really eat up a lot of resources; usually one engine can extinguish a dumpster or a vehicle fire, investigate, and clear the scene in 30 minutes or so. Based purely on fire activity, though, a station that’s running three fires a day looks like a hot spot. Again, total commitment time was still less than two hours for the day (counting cleanup).
Station 3 might be on the edge of a freeway. Multiple-casualty incidents, big-rig wrecks, rollover accidents, and extrication might be bread-and-butter calls. Let’s say personnel average one of these incidents a day. Average commitment times might run around two hours, but they’re going to need help—usually a second engine is enough for most of their incidents. Based on call volume, this looks like a slow station—one call a day. However, two engines committed for two hours equals four hours of total commitment time in their response area.
Station 4 might be positioned out in the boonies—a quiet place that averages about one call a day. That station, in this case, runs mostly fires. Because of the location, most of these fires are big and require a lot of extra help. For simplicity, let’s say that most of these incidents can be managed with three fire engines in about four hours. That sleeper station is now tying up around 12 hours of apparatus commitment time every day.
Maybe Station 5 covers an industrial/commercial area—fewer incidents but one good commercial structure fire a year. Let’s say that on average the annual “Big One” goes to three alarms. Fifteen engines committed for 24 hours equals 360 hours or about one hour a day for the year—big dollar loss but minimal commitment time when you spread it out over the year.
Let’s say Station 6 sits between an area protected by a city fire department and an underserved area of a neighboring county. This station may routinely run into the neighboring county on mutual aid and receive mutual aid from the nearby city fire department. A city fire engine providing mutual aid would not be counted in the apparatus commitment times, but time committed to mutual aid in the neighboring county would be counted.
THE CUTTING ROOM FLOOR
Other studies have proven that increased firefighter staffing reduces injury rates. Maybe my sample size was too small, but I couldn’t find enough injury or accident reports to prove anything. I would like to attribute this to the fact that our strategy and tactics are based on the capabilities of available resources and that we do the best we can with what we’re dealt on any given day.
The variable of special projects was eliminated for two reasons: None of the special projects identified were location dependent, and we had a lack of documentation to support the estimated personnel hours committed. Fire loss statistics were excluded because they represent rough estimates instead of hard data; they are primarily a result of socioeconomic and environmental factors and response times, which were evaluated elsewhere in this study.
Each of our fire stations is assigned some sort of special project. Some handle administrative items (e.g., filling overtime), others handle repairs (e.g., small engines, radios, self-contained breathing apparatus, and fire hose, for example), one runs the warehouse, and another manages the hazmat team. Some have hydrant details and heavy fire prevention/inspection loads; others do not. Each of these projects keeps station personnel busy, but we are poor at keeping track of the amount of time dedicated to the work.
STATISTICAL ANALYSIS
The variables were then grouped into four categories: RHAVE scores, Apparatus Utilization, Response, and Socioeconomics. The variables listed were cross-checked for statistical correlation to ensure their validity and relevance.
Correlations observed between RHAVE scores and call volume, RHAVE scores and population, and RHAVE scores and apparatus utilization were strong enough to validate the use of these variables as indicators. These correlations infer that population density can be associated with call volume and that RHAVE scores are generally indicative of population density.
Correlations between assessed valuations and percent unemployed, assessed valuations and the difference between first-due and third-due arrival times, and assessed valuations and average annual call volume were strong enough to validate the use of these variables as indicators. These correlations imply that real estate values can be associated with employment levels, that response times improve in relation to real estate values, and that call volume increases with real estate values. One could also infer that higher unemployment levels are common to less populated areas and that our stations are generally located near the population centers they serve.
Correlations observed between call volume and education level, call volume and percent college educated, call volume and percent below poverty, call volume and percent enrolled in school, and call volume and indicators of parental presence were strong enough to validate the use of these variables as indicators. These correlations infer that less educated, poorer, and younger populations are more likely to require services from the fire department.
Correlations observed between call volume and average response times for first-due apparatus, call volume and the difference between first-due and third-due arrival times, and call volume and the percentage of calls with a volunteer response were strong enough to validate the use of these variables as indicators. There was also a correlation between first-due and second-due response times. These correlations imply that busier companies tend to be located in higher-demand areas and are more likely to benefit from a volunteer response.
Although these observed correlations were strong enough to verify the validity of the components assigned to the decision matrix, none were strong enough to be considered viable for further statistical analysis. There was a strong correlation observed between average annual call volume and apparatus utilization rates, which merely indicates that busier engine companies spend more time committed to emergency incidents.
MORE MATH STUFF
Assigning weights or values to these factors was difficult. This project quickly transitioned from a research project to a very complex math problem. I sent my work off to the math department at our nearby university campus and had a handful of graduate students working on it in their spare time. There might be a better way to solve this problem mathematically. I wasn’t a math major and frankly found myself wishing that I’d paid more attention in class.
With that disclaimer, here’s how I approached the problem. The results of multiple regression studies were inconclusive. After reviewing the patterns and correlations, it became apparent that the solution was in the outliers. Descriptive statistics were used to identify the mean and standard deviation of each variable group and mathematically describe how far above or below the norm each result fell. Next, a simplified version of a statistical technique called bootstrapping was applied to assign a relative value to each subcomponent that reflected comparative levels of risk and workload. Finally, these comparative totals were combined to create an index of the workload, risk, and exposure with which each station had to deal.
WRAPPING IT ALL UP
The goal of this project was to determine where one additional firefighter would produce the greatest benefit to the department. The decision matrix included 15 factors grouped into four categories to ensure that the final product was based on a comprehensive analysis of the problem. The mathematical formulas were incorporated into an Excel spreadsheet, creating a trial version of the staffing decision matrix for my agency’s use.
The relative values Percent Undereducated, Percent Unemployed, Percent Living in Poverty, and Percent Unattended Children were totaled, and the result was multiplied by the relative value Population. This new value was transferred to the Socioeconomics column. The four socioeconomic indicators used in the calculation are all documented indicators of increased fire activity. On a broader plane, these factors are indicative of increased calls for service. Population was used as a multiplier to indicate the proportional value of these socioeconomic risk indicators for each zip code area.
The relative values Average Response Time—First Due, Average Response Time—Second Due, Average Response Time—Third Due, and Average Difference Between First-Due and Third-Due Response Time were added together to arrive at a Response Time value for each station. These four factors were combined to provide a broader perspective on apparatus response times into each response area included in the study.
The relative value Percentage of Calls with a Volunteer Response was multiplied by the Average Volunteer Response to arrive at a Volunteer Value. These factors were combined to indicate the number of volunteers that could reasonably be expected to respond to any given incident.
The Response Times Values and Volunteer Values were added together. The result was multiplied by the relative value Average Annual Call Volume. This new value was transferred to the Response column. Response Times and Volunteer Values were combined to assign a value to the speed and weight of attack that could reasonably be expected in each response area. Call Volume was used as a multiplier to indicate the frequency of occurrences.
The relative value, Total Apparatus Hours Committed, was transferred to the Apparatus Utilization column of the decision matrix. This variable was viewed as an indicator of the frequency and severity of incidents, associated workload occurring within each response area, and a way to value the assistance received from mutual-aid or automatic-aid agreements. Apparatus responding from other agencies were not included in internal incident response reports. It can be inferred that assistance from outside agencies is reflected in the apparatus utilization figures by reducing the total apparatus hours in this column.
The results from these four columns were then added together to provide a comparative value for each station. The final results—a combination of risk and workload indicators—were then ranked highest to lowest to arrive at a prioritized list that indicates which stations would benefit the most from additional staffing. Working backward, this formula could also be used to determine which stations would suffer the least if staffing reductions were necessary.
In the absence of accepted industry standards on the topic, this project may provide guidance and direction for the development and refinement of guidelines for staffing decisions. The lack of industry standards and guidelines on the issue and the fiscal pressure currently facing most fire departments in America beg the need for further development.
Editor’s note: The following article is a brief summary of the author’s first-year research project for the National Fire Academy’s (NFA) Executive Fire Officer Program. The full report will be available soon through the NFA’s Learning Resource Center online card catalog. The author has developed an Excel-based version of the decision matrix presented. If you would like a copy, send your request to maryjd@pennwell.com, and we will forward it to the author.
DWIGHT GOOD began his fire service career in 1992 as a volunteer firefighter for the Mariposa County (CA) Fire Department. He is employed by CAL FIRE in the Madera, Mariposa, Merced Ranger Unit, as a fire apparatus engineer. He has a bachelor’s degree from Empire State College and a master’s degree from Grand Canyon University.

