Dallas Develops Variety of EMS Data To Help Make Management Decision
features

Assistant Chief, Administration Dallas Fire Department
Data collected by an emergency medical system can be handled in various ways to provide a basis for making management systems. In Dallas, the computer printout of our monthly report runs about 300 pages and contains 16 different headings (or sections) that cover each ambulance run as well as each ambulance activity in several ways.
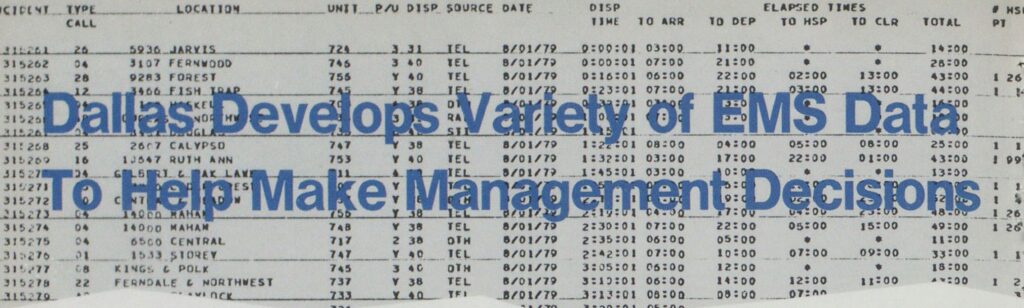
The first section of the report, “listing by incident,” covers all the runs made during the month. Each run is annotated by incident number, followed by the type of call (numerical code 1-40), the address of the incident, the ambulance (MICU) making the run, whether it used red lights and siren to the hospital (again by code—700 series if the red lights and siren were not used and 300 series if they were).
Transportation information
This is followed by a coding which indicates whether transportation was provided. A “Y” means transportation was provided. A “1” in this column means the run was a malicious false alarm. A “2” means there was no sick or injured party at the scene. A typical example would be an auto accident that was reported as involving injuries but after arrival, it was determined that there were no injuries. A “3” means the fire department paramedic advised the patient that he did not require emergency transportation and should take an alternate means of transportation to the hospital. A “4” means the patient did not wish to go by fire department transportation. A “5” means the patient left the scene before our unit ar-
rived. A typical case would be an aggravated assault or cutting victim who fled the scene and could not be located. A “6” in this column indicates the MICU was disregarded —either by the original caller, a police unit at the location, or a fire company on the scene.
The next column identifies the dispatcher who handled the call. This is followed by the way the original call was received. The date of the alarm is next, followed by the hour and minute of dispatch. The next column shows the response time in minutes—from dispatch until the MICU was on location.
The next column shows the length of time spent working with the patient before the trip was started to the hospital. This is followed by the transportation time to the hospital from the scene. Following that is the length of time the MICU was out of service at the hospital. The next column shows the total time from dispatch until the vehicle was again available for another run. The last two pieces of information show the number of patients on that particular case and the hospital the patient was taken to.
Transport totals, averages
The next section, “incident and average response time,” is a summary of the previous report concerning the total number of cases where transportation was provided and gives the average response times for those cases. It shows the average elapsed time (AET) from arrival at the scene until transportation was started. It shows the AET from departure of the scene until arrival at the hospital; followed by the AET from arrival at the hospital until the vehicle was available for another response. Following that is a slightly different way of looking at the information in that it shows the AET from dispatch until departure to hospital, AET from dispatch until arrival at hospital, and AET from dispatch until clear from hospital.
The next item shows the number of cases where the MICU was turned back while still en route, followed by the AET on these cases. The next part of the same report deals with the cases where the MICU arrived on the scene but did
not provide transportation to the hospital. It again shows the average response time, AET from arrival to departure, AET from dispatch to departure, and dispatch to clear. The next item in this section deals with the total number of cases where transportation was not provided. It lists the total number of cases not transported for each of the six no-transport categories. The last item shows the total calls received by the system for the month.
Individual MICU data
The next section shows the same information as the listing by incident report except that the report deals only with a specific MICU. For example, all the runs made during a month by Unit 703 are grouped together.
The fourth section gives the following information about the same MICU:
- Number of calls for each day of the week during the month.
- Total calls for the month.
- Average response time for all calls.
- Number of calls for each of the 24 hours by day of week.
- Average response time for each of the 24 hours by day of week.
- Number of calls for each of the 24 hours for the entire month.
- Average response time for each of the 24 hours for the entire month.
The next section covers the whole system in the same manner as the individual MICUs in the previous section. It shows the activity for each MICU and for the entire system on a calendar day basis. The printout lists for each day and vehicle the number of runs made and the response time for each 24-hour period. A monthly total is shown for each vehicle, along with the average response time for that particular vehicle. The final item shows totals for all MICU runs each day, the daily response time average and then the totals for the system for the month.
Way calls are received
A “unit territory/alarm source” section shows the ways the calls are received by unit number. There are five ways the calls are grouped:
- Other—This covers the calls received by computer terminal from the police department.
- Police—Calls that are received by telephone from police dispatch.
- Still—Walk-in at a fire station.
- Radio—Fire apparatus or ambulance notification to the communications center that ambulance is needed.
- Telephone—Calls that are re-
- ceived from the public over the 744-4444 number.
A section titled “unit territory/code to hospital” shows the response code from the scene of the accident or illness to the hospital. A code 1 indicates the MICU obeyed all traffic regulations and drove at normal speeds to the hospital.
A code 3 indicates that red lights and sirens were used in transit. The report shows the number of code 1 responses, the number of code 3 responses, and the totals for each vehicle. Beneath each figure, the percentage of cases for each MICU falling into each category is shown. Naturally, a systemwide total is shown covering the same information.
Transportation to hospitals
Following this is a “unit territory/ hospital” section. It shows a listing of all hospitals to which patients were transported during the month, the number of cases transported to each hospital by each MICU, and the percentage of that unit’s cases that were transported to that particular hospital. The totals listed on the extreme right of the printout shows the total number of cases transported to each hospital and the percentage of the total cases received by each hospital.
The “unit territory/type call” section shows the 40 basic types of calls shown on the patient form. A vertical column shows all 40 types of cases. A horizontal column shows each MICU and totals. Under each unit number, the number of cases of that particular type and the percentage of that unit’s calls are shown. Naturally, the final column shows the total number of each type of call, along with the percentage of all calls for that particular type of call.
Detailed data on cases
The next section shows several things concerning each case. All incidents involving a particular type case are grouped together (e.g., heart, gunshot, etc.). The first column under a given type shows the incident number followed by the number of patients on that case. The next column shows which vehicle(s) handled the case and whether red lights and siren were used. The next column shows the patient’s name. Next is the location of the emergency. Following that are the date and time the call was received. The next column shows which hospital received the patient. The” next column shows what type of IV fluids were used. This is followed by a column showing which drugs were administered. The drugs are shown by an alphabetic code to conserve space. If a numeric code were used, it would require commas for separation. The codes are:
- Sodium bicarbonate
- Lidocaine 1%
Section Headings Used In Dallas EMS Report
- Listing by incident
- Incidents and average response time
- Unit activity for month
- Monthly activities by days and hours for month
- Unit territory/day
- Unit territory/alarm source
- Unit territory/code to hospital
- Unit territory/hospital
- Unit territory/type call
- Type of cases handled
- Number of transports/type of call
- Hospital/type of patient
- Code to hospital/type of patient
- Type of IV/type of patient
- Drugs/type of patient
- Aid/type of patient
- Lidocaine 4%
- Atropine
- Isuprel
- Levophed
- Epinephrine
- Calcium chloride
- Benadryl
- Valium
- Dextrose 50%
- Narcan
- Ophthane
The final column shows the aid provided in the field by the paramedic. It, too, is given by the following alphabetic code to conserve space:
- EKG
- Telemetry
- IV
- Drugs
- Defibrillation—successful
- Defibrillation—unsuccessful
- Esophageal airway
- Endotracheal intubation
- Oxygen
- CPR—successful
- CPR—unsuccessful
- Controlled bleeding
- Bandaging
- Splinting
- Spineboard
- Anti-shock measures
- OB—live birth
- OB—still birth
- Rotating tourniquet
- Transportation only
- None
- Other
As can be shown, a great deal of information can be given in a very short space using this method. For example, ABCDEHIJ means an EKG was run, telemetry was sent to the hospital, an IV was establish, drugs were administered, the patient was defibrillated successfully, the patient was intubated, oxygen was given, and the CPR was successful (patient was alive when the paramedics left the hospital).
Since there is a considerable difference in t he number of calls made and the number of patients taken to the hospital, we wanted a breakdown as to why they were not transported. The coding system indicates:
- False alarm.
- No sick or injured person.
- Fire department refused transportation
- Patient refused fire department transportation.
- Patient left scene.
- MICU disregarded.
This section, “no transports/type of call,” lists each type of case along with the number of each type which did not require transportation by one of the six codes. This is followed by a total of each type not requiring transportation.
The next section, “hospital/type deals with the type of patient taken to each hospital. Each of the 40 types of cases is listed vertically and hospitals are listed horizontally.
Code used to hospital
The next section, “code to hospital/ type of patient, shows by type of case (aggravated assault, alcohol, asthma, etc.) the number of cases transported code 1 or code 3 and the percentage of each mode of transportation for each type case.
The following section, “type of IV/ type of patient,” shows the types of cases in a vertical listing, with the number of IVs of D5W or Ringers lactate by each category of patient.
The “drugs/type of patient” section shows once more a vertical listing of the types of cases and horizontally the number of times each drug was administered to each type of case.
The final section, “aid/type of patient,” shows the number of times each aid was provided for each type of patient.
The monthly report printout is received in duplicate about the 20th of each month. One copy is kept in the ambulance division office and the other is sent to Paula Schultz, R.N., who is in charge of the system research. She is employed by the University of Texas Health Science Center at Dallas— Southwestern Medical School. She is responsible to James Atkins, M.D., assistant professor of internal medicine in the cardiopulmonary section, and to Erwin Thal, M.D., associate professor of surgery.
Observations concerning the individual reports have been purposely omitted. We have merely tried to illustrate one method of data collection that can be used as a basis for making management decisions and can provide a compendium of information for researchers to prove or disprove the efficacy of such a system.

