BY WARNER R. WINBORNE
Three years ago, I took a critical look at vehicular line-of-duty deaths (LODDs) (“Sizing Up Vehicle-Related LODDs,” Fire Engineering, June 2009, 93-96). I suggested that those accusing firefighters of a culture of reckless, aggressive driving habits were focused on the spectacular yet isolated events of firefighter LODDs by vehicular causes and failed to see the millions of miles we drove without a fatal incident. Like the incident commander who develops tunnel vision on the fireground, those who asserted that ours is a dysfunctional culture of recklessness failed to look at the larger picture. As my article also showed, a look at the larger picture demonstrated a rate of vehicular fatality per mile nearly identical with that of civilian traffic. The data showed that “firefighters are no more reckless than civilians, even though we drive to a fire while they drive to work.”
But that conclusion was based on data from a single year (2004) and on assumptions about the number of miles driven on an average fire call. Although the data supported that conclusion, were the data reliable? Did the data reflect general conditions, or were the data an aberration? Has the situation changed since 2004? Just like the incident commander who must reassess conditions to consider the effectiveness of his strategy and tactics, so we, too, must reassess vehicular LODDs to determine whether conditions have improved, have remained the same, or have deteriorated.
However, the analysis is not so easily made. As noted before, the data needed to determine whether firefighters are more reckless behind the wheel are not readily available and must be compiled from several sources. The National Highway Transportation Safety Administration (NHTSA) collects annual data on the number of fatalities per 100 million miles driven. These data are collected for both commercial and civilian traffic. If ours is a dysfunctional culture of aggressive driving, we should expect to see fatality rates greater than those for civilian traffic. Commercial traffic is largely over-the-road (OTR) trucking-long-distance highway driving. We encounter this driving condition only rarely in the fire service. Since we undergo driver training more in line with that of professional drivers, it is tempting to suggest that the more appropriate comparison would be between the fire service and commercial (i.e., professional) vehicular traffic, but keep in mind that commercial traffic is overwhelmingly highway traffic, while fire apparatus travel where soccer moms drive. As a result, our comparison will be between fire traffic and civilian traffic.
Fatality rates for civilian traffic have seen a slow but steady decline over the past 15 years, from 1.73 fatalities per million miles in 1994 to 1.14 in 2009. The number of vehicular accidents has been fairly constant at around 35,000 per year, although those numbers dropped in 2008 and 2009. An obvious conclusion here is that mandatory seat belt laws and air bags have not made collisions less frequent, but they have made them more survivable. We should expect similar declines in vehicular fatalities in the fire service, for the same reasons.
SOME PRELIMINARY ASSUMPTIONS
On the fire side, we do not collect data on the number of miles driven per year. Three years ago, I estimated the total number of miles driven by making two assumptions. First, I assumed that the average call would see three fire apparatus responding. Clearly, some routine calls will only see one or two vehicles dispatched, while other, admittedly rarer calls, will see significantly more vehicles on the road. As an example, a recent single-family residential structure fire in my district involved seven pumpers, seven tankers, and 10 utility or support apparatus. An average of three apparatus per call strikes me as reasonable.
Second, I assumed that the average distance from station to call was five miles, or 10 miles round trip. For stations in urban settings, these numbers may seem a bit high. However, there are addresses in my district that are 15 miles from the station. On the structure fire mentioned above, which involved a tanker shuttle, those seven tankers traveled five miles from the scene to the fill site and back again, or 10 miles on the road for every load of water. An average of 10 miles per call per vehicle, then, also seems reasonable.
Therefore, my assumption is that each call would mean three vehicles traveling 10 miles, or a total of 30 miles of exposure per call. Of course, fire apparatus are on the road even when not responding to calls (whether for training or public service). So even if my assumptions are on the high side, my estimate of total mileage is likely to be a bit low.
Data on number of calls are available, but they are often difficult to gather. For instance, the United States Fire Administration’s (USFA) annual report Fire in the United States indicates the number of fire calls and the percentage of fire calls to the total number of incidents. To calculate total calls is a matter of simple math. However, the data from the USFA are incomplete, as they are based on the National Fire Incident Reporting System (NFIRS) reporting. Not all fires are reported to fire departments, and not all fire department responses are reported to NFIRS. Although the former is immaterial to our purposes (if a fire is not reported to the fire department, no apparatus will respond), the latter suggests that the number of total responses is likely to be underreported. Since we must estimate total miles for emergency vehicles and since we are only considering emergency response and since our estimate of total emergency response is likely to be low, our estimate of total miles driven is likely to be low.
In short, I have likely underestimated the average number of apparatus on a given call, the average number of miles driven on a given call, and the total number of calls. On top of that, we put vehicles on the road in the line of duty when not responding to calls. So my calculations are likely to err on the conservative side. Thus, if we see fatality rates at or below those of the civilian population, we can be confident that the rates are not an artifact of our estimates.
WHAT IS A VEHICLE?
It is important to note that this analysis includes only licensed emergency vehicles; other vehicles were excluded for several reasons. First, the question is whether the fire service suffers from a dysfunctional culture of aggressive and reckless behavior behind the wheel. Hence, it makes no sense to include firefighter fatalities from aircraft, which surprisingly occur with some regularity. Indeed, in 2004 half of the 28 vehicular LODDs involved aircraft. Moreover, fatalities involving all-terrain vehicles (ATVs) or other off-road vehicles are also excluded. It makes no sense to say that we perish in accidents because we fail to fasten our seat belts or to come to a complete stop at red lights if we include fatalities from aircraft and ATVs in the picture.
More controversial is the exclusion of fatalities in privately owned vehicles (POVs). These are excluded from the analysis for a couple of reasons, one practical and the other methodological. As a practical matter, it is not possible to calculate the number of miles firefighters drive in their private vehicles. As such, it is not possible to compare fatalities involving POV response to fatalities for ordinary, civilian traffic. We can estimate the number of miles that fire apparatus are driven; we are unable to estimate the number of miles firefighters drive in their own vehicles.
Second, the claim that ours is a dysfunctional culture would be validated if we found evidence of that culture in fire apparatus response. That is, if we are reckless as a fire service, then we should see increased fatalities in fire service apparatus. It is with fire service response that the fire service is on display. If, for example, an apparatus is operated unsafely, the officer in the right-hand seat is responsible to correct the matter, but there is no officer in the right-hand seat of a POV. The fire service has a much greater degree of control over the operation of department apparatus than it does over POVs.
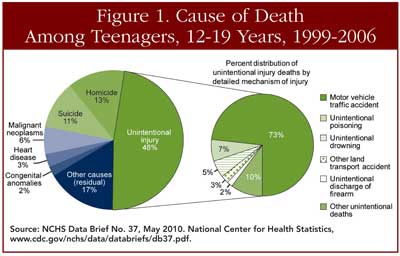
Moreover, there are more compelling explanations for POV fatalities than a dysfunctional fire service culture. The overwhelming majority of these fatalities involve very young, often teenage, drivers. In 2004, of the eight vehicular LODDs involving POV responses, seven were teenagers. On March 21, 2010, two firefighters and a civilian were killed in a POV crash involving two vehicles driven by firefighters returning from training. The firefighters were street racing along a highway in heavy rain. The driver of one vehicle was 18 years old; the other was 23. What makes these drivers reckless are youth and immaturity, not their role as firefighters. The leading cause of death for teenagers is accident, and the leading mechanism of injury for accidental death among teenagers is vehicular. Teenagers do reckless things behind the wheel not because they are firefighters but because they are teenagers (Figure 1).
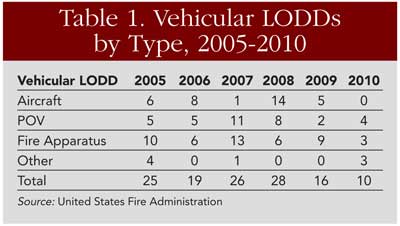
So, how reckless are we? Although my original article used data from 2004, data are now available from 2005 to 2009. For comparison, the 2004 data that I used to make the original argument that ours is not a dysfunctional culture are also included. Table 1 reports vehicular LODDs by type. The USFA does not make this distinction. The numbers are derived from the narrative in the annual reports-they are accurate insofar as I can tell.
Although POV fatalities outnumbered fire apparatus fatalities in only two of the six years, they are a significant problem for the fire service. However, POV fatalities do not demonstrate a culture of reckless abandon in the fire service. To determine whether the fire service is indeed dysfunctional, we need to compare fire service fatality rates with civilian fatality rates. Such a comparison is drawn in Table 2, and the data suggest that the fire service driver remains no more reckless behind the wheel of an emergency apparatus than the average driver.
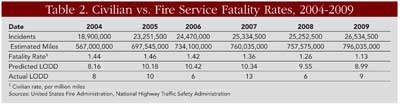
As we can see, our fatality rate is not significantly different from that of civilian traffic. In 2004, 2005, and again in 2009, our fatality rate while responding in emergency vehicles was almost exactly the same as the civilian rate. We suffered a slightly higher rate of vehicular fatalities in 2007 and a slightly lower rate in 2006 and 2008. This reassessment of the data strongly suggests that the original conclusion that ours is not a dysfunctional culture of aggressive driving is correct. Moreover, the conclusion that attempts to reduce vehicular LODDS are unlikely to produce significant results is also further supported by this reassessment.
Preliminary data from 2010 suggest further that ours is not a dysfunctional culture. In that year, only two vehicular LODDs can be attributed to the operation of an emergency vehicle. A third firefighter was killed while operating a department-owned flatbed trailer hauling a D5 Caterpillar plow. Data from the NHTSA are as yet unavailable to complete the comparison between fire service and civilian vehicular deaths for that year, but it is inconceivable that firefighters suffered an above-average fatality rate if only two deaths from the operation of a fire apparatus were recorded.
CONCLUSIONS
Given the evidence, the data support a number of conclusions.
- Ours is not a dysfunctional culture of recklessness behind the wheel. Although there may be isolated events of unsafe operation of emergency apparatus, on the whole we are no more likely to be involved in a fatal collision than the general public. This, it seems to me, is cause for congratulations, not condemnation.
- Driver training works. Nothing in the data above suggests that driver training is unnecessary. To the contrary, the fact that we suffer no greater a fatality rate than the general public even though we are responding in an emergency capacity at short notice at all hours of the day and night is evidence that driver training works. Driver/operators should continue to train, and officers should continue their vigilance in ensuring the safe operation of fire apparatus.
- The attempts to reduce vehicular LODDs are unlikely to have any appreciable effect. Although the goals of the firefighter Life Safety Initiatives and the Everybody Goes Home campaign are noble, they are unlikely to significantly reduce vehicular LODDs. By my estimates, we put an average of 767 million miles on the road each year in emergency apparatus. Without reducing that tremendous exposure to risk, we are unlikely to see a reduction in firefighter fatalities in emergency apparatus. I certainly share the desire to reduce the number of “preventable” firefighter LODDs. I simply point out that, given the number of miles we drive, we may not be able to prevent many more LODDs for emergency apparatus. Firefighter safety should remain our top priority, and, as such, efforts should be focused in areas such as health and wellness, which are more likely to reduce firefighter LODDs.
- Departmental policies requiring safe operation of fire apparatus work, and they should be implemented wherever they are not, and enforced. A recent story from California of an apparatus operator who drove through a red light at 55 miles per hour, smiling for the traffic camera, is a case in point. The department policy was a top speed of five miles per hour through an intersection, after stopping for the red light. My understanding is that the apparatus operator has been demoted and lost his driving privileges.
- POV response is a significant source of vehicular LODDs, and one where increased attention may pay some dividends. Although it is inappropriate to blame the fire service for the exuberance of youth, it is incumbent on fire departments to adopt clear policies regarding POV response and to enforce those policies consistently. Safe driving policies for personal vehicles should be articulated, modeled by the officers and senior members, and enforced rigorously.
- Seat belts continue to save lives, and mandatory seat belt use is an obvious and easy policy to apply not only to department apparatus but also to POV response. Of the eight POV fatalities in 2004, seven of them were not wearing seat belts. In the single fatal accident in 2010 involving a fire engine, neither firefighter was wearing a seat belt. Yet what killed those firefighters wasn’t their failure to wear seat belts but their failure to stop at a red light. Moreover (and also noted in my 2009 article), mandatory seat belt laws and the recent inclusion in emergency vehicles of audible alarms when seats are occupied and belts are not fastened are already maximizing seat belt use.
Departmental policies on emergency vehicle operation-e.g., requiring vehicles to come to a full stop at all red lights and stop signs-will do much to keep us safe. Policies mandating seat belt use will likely be most effective in curbing POV deaths, as it is in these cases where departmental training and direct supervision are less of a factor.
Good strategy rests on good information. If we fail to understand the situation before us, we will either fail to adopt the proper goals or we will fail to adopt the proper means to reach those goals. This is as true when sizing up a structure fire and coming up with a plan as it is when considering firefighter LODDs and coming up with a plan to increase the odds that we all go home.
WARNER R. WINBORNE is associate professor of government and foreign affairs at Hampden-Sydney College in Virginia and a volunteer with the Hampden-Sydney (VA) Volunteer Fire Department.