BY KURT MUELLER
The need for efficient communication, mandated data collection and reporting, and computer-based training methods has digitized the fire service. In view of the overall evolution of the fire service, computers are a very recent development. Today, however, computers and Internet access have become the norm in fire and rescue stations. The computerization of the fire service, from the office to the pump panel, continues to spread and affect our working environment. We are better off accepting this reality and managing it rather than trying to avoid or fight it. But, an important question arises: How extensive does our personal computer (PC) infrastructure have to be? How do we decide where, when, and how many computer systems to install? Should we issue laptops to our probies in rookie school, along with bed linens and personal protective equipment?
The purpose of this article is to share what I, as part of a promotional assessment process, and our department have gleaned by conducting a scientific needs assessment for PCs in fire stations, to share with you a method for matching the needs with the demands and how to design a blueprint for a master plan.
In 2011, 80 percent of Virginia fire departments reported that they had a computer at their station; 19 percent had access to one at a different location, and only 1 percent claimed they had no computer. More than half of these departments (52%) enjoyed high-speed Internet, whereas a small minority (5%) had no Internet service at their stations.1 Nationwide in 2010, 16 percent of U.S. fire departments did not have Internet access. In departments that protected a community of 250,000 or more, 45 percent provided individual Internet access, and 37 percent provided access at each station.2
The information technology (IT) revolution has affected departments indiscriminately, regardless of size, budget, or whether volunteer or career. Chesterfield (VA) Fire and EMS (CFEMS), a combination department with 21 fire stations and eight volunteer rescue stations, was not exempt. We, too, learned to accept PCs as part of the fire station infrastructure. In fact, life without PCs in our stations is no longer imaginable. CFEMS uses at least two PCs per station; some have as many as five, and all have Internet access. Clearly, we are fortunate to have a well-developed IT infrastructure and a competent Information Management Technology (IMT) unit to maintain it. And yet, there never seem to be enough PCs for everybody! What makes matters worse is that CFEMS’ IT infrastructure is based on the traditional concept of stand-alone PCs with applications stored on the PC and data stored on their servers. Besides high costs for PC replacements, this concept generates significant recurring annual expenditures for each PC.
END-USER SURVEY
As an efficient method to reach out to the end users in the stations, I designed a simple five-question online survey at SurveyMonkey.com®. “End users allow you to capture data based on recent trends from the same group that you hope to influence through the outcome of the research,” says Dr. Jeffrey Ryan, head of the Department of Emergency Management at Jacksonville (AL) State University (JSU). Ryan, an accomplished researcher and author, teaches research design in emergency management at JSU at the graduate level.
The survey consisted of one open-end and four multiple-choice questions, plus a text field for respondents to leave comments (Figure 1). I considered the 364 full-time members assigned to CFEMS’ Emergency Operations Division as representative of the total population in Virginia’s fire stations. A sample group of 50 members (N=50) was selected. It consisted of company officers (36%) and firefighters (64%) who represented all-career fire stations. The survey was distributed by e-mail and remained open for two weeks.
| Figure 1. Computer Availability |
 |
Thirty-five members (n=35) replied to the survey, which represents a 70 percent response rate. This is high and might suggest the end users’ interest in the subject matter. Ryan points out that “generally speaking, the higher the response rate, the better the data set.” He reasons that “one might be able to state that a high response rate (>60%) enables the researcher to make better assessments of the population being queried.”3 The formulation of well-founded, reliable conclusions from the survey data was fundamental to the scientific needs assessment. Following are the responses to the survey questions.
Question 1. What are the most common tasks that require access and use of a personal computer at your station? (Select all that apply.)
Responses:
- patient care reports (PCRs) (88.6%)
- TeleStaff (Kronos®) (85.7%) (Chesterfield’s staffing program for managing payroll aspects ranging from requests for leave to signing up for overtime)
- National Fire Incident Reporting System (NFIRS) reports (82.9%)
- Outlook® (71.4%)
- requisitions and work orders (62.9%)
- work-related research and projects (54.3%)
- online fire or EMS training (48.6%)
- preplans (42.9%).
Question 2. Please identify the three most frequent tasks you do on a daily basis on your station computer.
Responses:
- TeleStaff (Kronos®) (88.6%)
- PCRs (74.3%)
- NFIRS (74.3%)
- Outlook® (45.7%).
Question 3. Generally speaking, are there too many, too few, or about the right number of computers available at your station to accomplish the tasks in a timely manner?
Responses: More than half of the respondents (60%) indicated that there were “about the right number”; the remainder (40%) said “somewhat too few.”
Refer to Figure 1 for a summary of these data. No one claimed that there were too many or too few computers available.
The input from question 3 was a useful indication of the access to PCs to manage firehouse business functions. The collective responses also suggest that there were enough computers available and that occasionally users had to wait to gain access to the PC. The fact that no one said that there were “much” too many or “much” too few computers suggested a well-established IT infrastructure in the stations.
Question 4. Inadequate Information Technology (IT) hardware at your station is the reason administrative tasks and/or computer-based training are being delayed or not done at all. (This was a follow-up question.)
Responses:
- Disagree, 45.7%
- Agree, 31.4%
- Agree strongly, 20% (Figure 2).
| Figure 2. IT Infrastructure Is Reason for Delays |
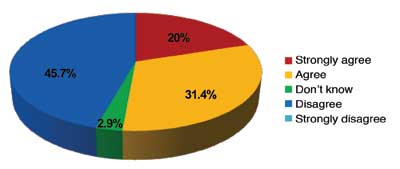 |
The responses from question 4 somewhat challenged the findings from question 3 and required further in-depth analysis. The explanation could be found in variations in the ratio of end users per available PC. It seemed that oftentimes the computers were tied up with PCRs and NFIRS reports. It could be reasoned that this problem was more prevalent at call-intensive stations during the daytime hours when all users are active and prefer to get most business tasks and online training done. The ratios are discussed in detail later in the article.
Question 5. What new or additional IT resources or changes in the use of existing resources would improve your overall effectiveness in your position?
Responses: Fifty-nine responses (n=59) were received. Table 1 shows a summary of the comments, sorted into 10 categories.
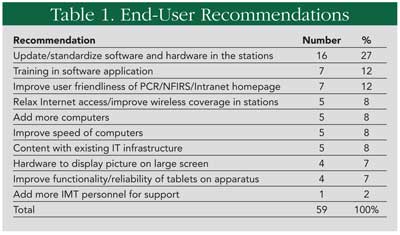
The highest percentage of recommendations addressed the need for updating and standardizing software and hardware in the stations (27%). This was followed by recommendations to provide more training in software application (12%) and to improve the user friendliness of the PCR and NFIRS program and the Intranet homepage (12%). There were recommendations to relax Internet access and to improve wireless coverage in the stations, to add more computers, and to improve the speed of computers (8% each). The same number had no recommendation and appeared to be content with the current IT infrastructure (8%).
The feedback from the sample group was indispensable for developing a master plan that was not only in line with economic principles but also endorsed by the end users.
The survey identified PCRs and NFIRS reports as the tasks for which the station computers were used most often. A request for the number of PCRs and NFIRS reports written per station during Fiscal Year (FY) 2011 turned out to be unrealistic. These reports are identified by the person who writes them and not by geographic location, where they were written. Instead, I settled for EMS calls and the total calls for service (CfS) per station during FY11 as comparable workload measures for PCRs and NFIRS reports. Although not the same, they serve as comparable indicators of potential PCRs and NFIRS reports written in each station.
Next, I obtained an inventory of PCs to determine how many are accessible to firefighters for preparing PCRs and NFIRS reports and to calculate ratios. A spreadsheet was created to calculate the ratio of firefighters per available PC, the ratio of EMS calls per PC, and the ratio of CfS per PC in each station.
Since the objective was to determine how many PCs were available to firefighter end users, we did not include PCs assigned to company officers, safety officers, battalion chiefs, the shift commander, and specialty shops (in-house repair and maintenance shops, such as the sewing shop, hose and nozzle repair shop, and electrical shop managed in the stations by on-duty personnel). These positions warrant their own PC.
The ratios revealed that six stations exceeded a firefighter per PC ratio (FF/PC) of more than three. Two stations, on the other hand, showed a ratio of fewer than two firefighters per PC, which was indicative of an overabundance of PCs. Five stations showed a ratio of more than 1,500 EMS calls per PC (EMS/PC), which suggested a task overload per available PC. The same five stations also showed a ratio of more than 2,000 CfS per available PC (CfS/PC). All other stations were within what I considered to be reasonable ratios.
Based on the ratios, my conclusion was that the five stations with unfavorable ratios in all three categories had not only maximized their available PCs but they were in need of an additional one. In contrast, the ratios for the two stations of fewer than two firefighters per PC revealed an underutilization of PCs.
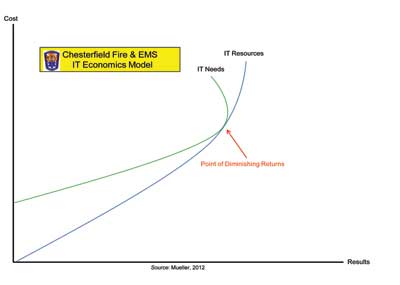
| Figure 3. CFEMS IT Economics Model |
 |
A study of most current trends and how other organizations met their IT needs was vital in developing a best value blueprint. For this purpose, I conducted a topical literature review with a focus on the military and public schools, reached out to a network of executive fire officers, and initiated contact with the neighboring Henrico County Department of Information Technology. Learning from existing research and users outside Chesterfield County not only expanded the perspective but also prompted new ideas and points of consideration.
The goal of the business needs assessment was to produce a blueprint that ensured the appropriate level of IT resources to meet the IT needs at each station. The applied principle of best value aimed at the highest level of productivity (results) at the lowest price (cost) possible. The economics model in Figure 4 illustrates the applied principle of best value.
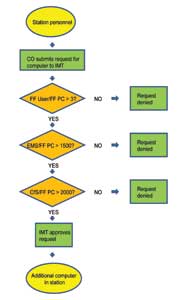
| Figure 4. Justification Process for Computers |
 |
The CFEMS IT Economics Model demonstrates how building up the IT infrastructure inevitably satisfies the justifiable IT needs. This occurs where the two curves intersect, which denotes the point of diminishing returns. The model shows that adding IT resources ultimately continues to create cost without producing results. Similarly, the justifiable IT needs are eventually satisfied and, after that point, will continue to generate cost but will fail to produce results. In that sense, I argue that the point of diminishing returns is the demarcation point between resourcefulness and waste.
Finding the point of diminishing returns for each station was the key for the business needs assessment. For this purpose, the identified ratios and “trigger points” were used. The trigger points functioned as “if-then” criteria. If all criteria are met in sequence, the justification for a computer exists. For the “FF/PC” ratio, the identified trigger point was fewer than two and more than three firefighters per PC. The former was considered underutilization; the latter indicated a shortage. For the “EMS/PC” ratio, the trigger point was set at 1,500 EMS calls per PC. For the “CfS/PC” ratio, the trigger point was fixed at 2,000 calls for service per PC. Both numbers were identified as realistic trigger points after working through various scenarios with different numbers in the spreadsheet. The flow chart in Figure 4 illustrates how the ratios with the defined trigger points channel the decision-making process for adding more computers to a station.
Based on the findings from the study of most current trends and how other organizations met their IT needs, my recommendation was to incorporate virtual desktops into the future IT infrastructure. Virtual desktops were not new to our department. At that time, we were piloting three desktops at different stations. A Force Field Analysis revealed that while the virtual desktops have cost-effective qualities (driving forces), they also have limitations (restraining forces). However, my department found that if virtual desktops are used in combination with traditional PCs, the driving forces outweigh the restraining forces. Consequently, the recommendation was to use virtual desktops as a cost-effective means to supplement critical business functions whenever practical. Company officers, battalion chiefs, the shift commander, safety officers, and the specialty shops were found to be better served with their own traditional PCs. The computer designated to run the computer-aided dispatch system (CAD) needs to remain a traditional PC to support this system. The “CAD PCs,” however, can be better used if they are in a common area, as opposed to an office, and made available to firefighters for PCRs and other tasks.
The criteria from the flowchart identified five stations in need of an additional computer. Adding one more computer would lower their ratios to below the trigger point.
The excess PCs from two stations, conversely, would be retired to eliminate unnecessary expenditures. Both stations had a PC that was older than five years and, therefore, should be eliminated from the infrastructure without replacement. There were 10 more outdated PCs that were overdue for replacement to become compliant with a five-year refresh cycle. In line with the above recommendations, three needed to be replaced by a traditional PC and seven by a virtual desktop.
The proposed IT infrastructure should be realized over two fiscal years. For the second fiscal year, the refresh cycle of computers was to continue. By the end of the second fiscal year, every station that qualified for a second firefighter computer would have a virtual desktop instead of a traditional PC. As a result, the proposed blueprint for the IT master plan resulted in 37 PCs assigned to company officers, battalion chiefs, the shift commander, safety officers, and specialty shops; 22 PCs assigned to CADs and serving as the primary firefighter computer; and 16 virtual desktops designated as the secondary firefighter computer. The complete PC infrastructure in the stations is made up of 75 computers, including the computers for the station currently in development.
The results of the business needs assessment met my objectives. The process in itself, however, does not stop with the blueprint. The monitoring and evaluation of the effectiveness of the new IT infrastructure will present opportunities to revise the master plan as needed, depending on changing needs and resources. In that sense, the business needs assessment is not a onetime solution but an ongoing process.
The needs assessment was an educational experience. Going through the process helped me to better understand the needs of the end users and define measurable decision making for the allocation of PCs in the stations. Surveying end users as a method to capture and understand their opinions and needs was invaluable. Most importantly, we now have the ability to use a mechanism to manage and better control the computerization of our department.
References
1. Virginia Department of Fire Programs. (2012, January). Virginia fire service needs assessment: An annual profile of critical needs as identified by Virginia’s fire service [Annual report Volume VIII], p 43. Retrieved from Virginia Department of Fire Programs: http://www.vafire.com/fire_data_statistics/needs_assessment.html.
2. National Fire Protection Association. (2011, June). Third needs assessment of the U.S. fire service [Research report], p 160. Retrieved from National Fire Protection Association: http://www.nfpa.org/.
3. Ryan, J., personal communication, December 7, 2012.
● KURT MUELLER, M.S., EFO, is a captain with Chesterfield (VA) Fire & EMS, assigned to the Emergency Operations Division. He earned a master of science degree in emergency management from Jacksonville (AL) State University, an associate degree in emergency medical services, and undergraduate degrees in business administration. He is a 2012 graduate of the Executive Fire Officer Program at the National Fire Academy and is an active member of the Virginia Association of Hazardous Materials Response Specialists.
Fire Engineering Archives

