
Every firefighter thinks he knows how busy he is. If you ever want to know, just ask him during shift change tomorrow morning. In today’s world of fire-based EMS delivery, urban community-driven fire departments like ours are busy in many ways. The real question is, though, “How busy is ‘busy’?”
There are many ways to determine how well you use your community’s resources-so many ways, in fact, that each department probably tackles this topic uniquely. However, when you want to measure your department against other similar-sized agencies, a problem arises. There is no standard set for determining how busy is “busy.” Credible leaders move their organizations away from assumptions and subjective theories and make critical decisions based on and driven by real data.
Determining Department Data
In 2015, Henrico County (VA) Division of Fire (Henrico Fire), in central Virginia, responded to 46,310 incidents. Protecting the upper half of the metro-Richmond region, Henrico Fire staffs all 20 of its firehouses 24 hours a day. An advanced life support ambulance sits in 15 of those stations, and each ambulance is staffed by the same firefighters riding the engines, ladder trucks, or squads. The ambulances largely remain in quarters throughout the day and do not roam or sit on the streets. With no revenue recovery in place, Henrico Fire still provides totally free emergency medical services (EMS) and transport to our citizens.
During 2015, we saw a 6.3 percent increase in call load over 2014. This is the single largest increase in responses since we jumped into the world of EMS in the 1980s. Historically, our department is busy and has been for many years. In response to the increased system demand over time, Henrico Fire added ambulances, stations, and staffing. In the recent months, however, it was evident that theories of “busy” were no longer valid, and we needed hard data to support forecasting and start our transformation into a true data-driven organization.
To justify what is busy, solid data are required from solid sources to paint the picture of what your firefighters already know-or think they know! Counting monthly incident responses is not reliable; this subjective data can be perceived in many ways. Fourteen canceled calls or patient refusals are much different from 14 transports, yet it’s still 14 incident responses. So, how busy is busy?
To answer that question, I focused on quantitative data and how they affect our community. To quantify a standard for how busy is busy, I needed to identify measurable factors in our current data collection. The goal was to apply a number to the term “busy.” Web searches and textbooks came up short for identifying a fire service standard. There are, however, multiple Executive Fire Officer papers, private consulting agencies, and labor groups that post their recommendations on the subject. The problem is that these recommendations are based on differing methods of data analysis; thus, comparing recommendations is like comparing smooth bore nozzles to lamp shades-it just doesn’t make sense.
The one common denominator throughout much of the research is the term “utilization.” Unit Hour Utilization (UHU) is a general term you may know. Unfortunately, it is used to refer to many methods for analysis. UHU, in its proper form, is not appropriate for our industry’s decision makers when considering average call lengths and per-hour call rates. Since we don’t respond to average calls and are probably not attempting to break hourly records, UHU is not the answer. To distance ourselves from averages, numbers of incidents, transport-only analysis, and private industry profit goals, we needed something easy and effective.
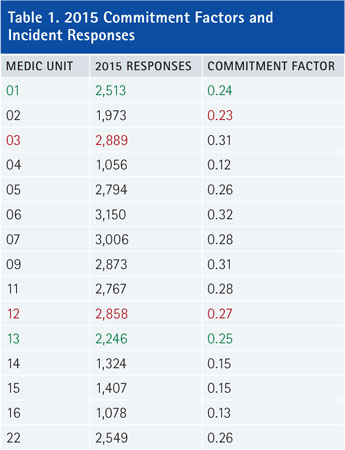
The basic answer is found in unit commitment, somewhat similar to utilization. We can determine how busy we are by analyzing our unit utilization through querying our total commitment. We simply divide the total seconds (yes, we’re counting seconds here) a unit is assigned to all calls by all the seconds in a year. With some easy math, the “commitment factor” is revealed. For example, Fire Medic 01 says it is on calls about six hours a day (21,600 seconds). By pulling the commitment time for 2014, we divide 7,648,213 (Fire Medic 01’s annual response time in seconds)/31,557,600 (one year in seconds) to reveal a commitment factor of 0.24.
As mentioned earlier-and as is evident in Table 1-counting incident responses is not as reliable as calculating commitment. Considering only the number of incidents, Fire Medic 13 should be relatively less busy than Fire Medic 01 (as shown in green), yet the contrary is evident. The truth is that Fire Medic 01 responds to more incidents but is in closer proximity to several hospitals. Fire Medic 13 is committed longer to incidents. Look at Fire Medic 03 and 12 (as shown in red); both ran a similar number of responses, but Fire Medic 03 is proven busier. Other examples may be seen below as well.
Calculating Commitment Factors
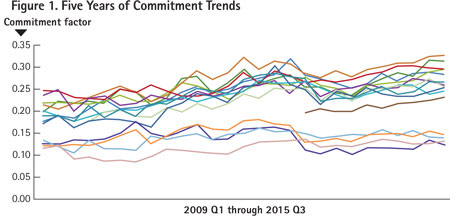
In 2015, Henrico Fire identified commitment factors ranging from 0.12 to 0.32. To take the next step, we analyzed five years of quarterly commitment factors and identified several points of interest. First, our unit commitment factors greater than 0.2 consistently increase, but those below 0.16 remain largely unaffected (Figure 1). This indicates that our busy units are getting busier (obviously), but our slower units will remain slow. Second, we found hard evidence to show how adding two units in the past five years impacted the total system. We also uncovered how long that impact will sustain itself before being absorbed into the system. All of this is good information that will support better decision making as the system continues to grow and develop.
Identifying Your “Busyness”
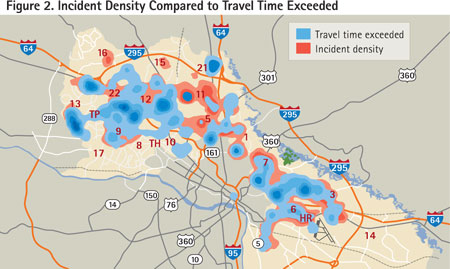
So, what now? So far, we identified a method to determine unit commitment factors, but without scale or benchmarks, these numbers are just fun facts. So, to figure out how busy is busy, we took the following steps: We analyzed direct community impact through travel time data and identified where/when we consistently missed travel time benchmarks and compared that to the commitment factors. By using geographic information system mapping, hot-spot analysis, and density maps (Figure 2), we added an illustrative factor to identify areas where we experienced the greatest number of incidents and exceeded travel time goals. With this analysis, we developed a general commitment factor scale, which follows:
- 0.16-0.24 indicates the “Ideal Commitment Range.” Personnel are able to maintain training requirements and physical fitness and can consistently achieve response time benchmarks. Units are available to the community more than 75 percent of the day. Units below 0.16 should be evaluated for more efficient use as additional operating capacity is available.
- 0.25 indicates “System Stress,” yet community availability and unit sustainability are not questioned. First-due units are responding to their assigned community 75 percent of the time, and response benchmarks are rarely missed. At this level, agency leaders must understand that commitment factor increases are imminent. The community this unit serves will begin to see increasingly longer response times as neighboring stations send apparatus during one out of four calls.
- 0.26-0.29 is the “Evaluation Range.” In this range, the community served will experience delayed incident responses. Just under 30 percent of the day, first-due ambulances are unavailable; thus, neighboring responders will likely exceed goals. Agency leadership should immediately begin identifying funding sources to provide relief. At this range, commitment factors are only expected to increase.
- 0.3 is the “line in the sand” for commitment factors. “Not Sustainable: Commitment Threshold” shows our community has less than a 70 percent chance of timely emergency service and immediate relief is vital. Personnel assigned to units at or exceeding 0.3 may show signs of fatigue and burnout and may be at increased risk of errors. Required training and physical fitness sessions are not consistently completed.
By providing real data and a scale to benchmark those data, we allow for data-driven decisions. Based on this ongoing study, we will evaluate the units that fall below 0.16 for better utilization. Peak hour movements and station transfers are just a couple of available options. We are now considering communities served by units at or above the “Evaluation Range” for relief.
How busy is busy? Without pulling and analyzing data, you honestly will not know. Using a standard methodology, applying it to your community, and basing decisions on the data are at the heart of where today’s data-focused fire service agencies operate.
Here, we know we are too busy in some communities and have additional capacity to operate in others. Data indicate we need to make changes to our system to compensate for our commitment factors. GIS tools identify areas to concentrate additional resources and also indicate overresourcing. Without data, though, we will continue to assume and make decisions based on how busy we think we are.
JOE POWERS is a 16-year veteran of and a lieutenant with the Henrico County (VA) Division of Fire (Henrico Fire) assigned to the planning section. Powers works closely with Henrico Fire’s accreditation process and process analysis and applies real data to drive decisions. He has a bachelor’s degree in health services from James Madison University.
Fire Engineering Archives

