For some reason, even in the age of big data, the fire service still doesn’t know how many rescues we effect each year. Our primary mission is life safety, and we don’t measure how many lives we save! How ridiculous is that? That’s like Apple not knowing how many iPhones it sells or the Yankees not knowing how many wins they have. We also don’t track where civilians are found, who finds them, how long it takes to find them, how long it takes us to remove them once they have been found, and how victims are physically removed from the fire building, and on and on. We do a great job of tracking our injuries and deaths for civilians and firefighters, but we have no idea of how many lives we save on the fireground.
Firefighter Rescue Survey
Fireground Rescue Survey (FRS) (firefighterrescuesurvey.com) was launched a little more than three years ago by a handful of firefighters across the United States who believe this information is vital to the fire service. Its aim is to decrease some of these unknowns. FRS gathers as much information as possible from rescues in the hope of making the fire service more efficient and effective on the fireground. By collecting data from firefighters who have been in the same situation most of us spend a career preparing for, FRS is endeavoring to improve the chances of firefighters worldwide to save lives.
Response Noteworthy
The response of the fire service to FRS thus far has been amazing. Up until the writing of this article, data related from 1,172 grabs (just shy of 39,000 data points) has been collected. This number is impressive, but it is likely just the tip of the iceberg. We know that more rescues are being made, but we don’t know how many more.
This data is important; it is the first time that we have crowdsourced the fire service for information about our rescues. We believe this data is the best tool we currently have for gaining insight related to our rescues. However, it is far from perfect and far from absolute. In the name of transparency, an obvious limitation of this data is that some questions and answers are subjective.
Another limitation is that the fire service has not yet collectively defined many terms relevant to search and rescue, which can cause confusion among respondents to the survey. Despite these limitations and the fact that the data does not answer all of our questions, we now have a “statistically significant” sample size from which we can dissect responses to determine information that can make us a little smarter and faster, thus better.
Some Findings
From the responses of hundreds of brothers and sisters from around the globe, we have learned the following so far.
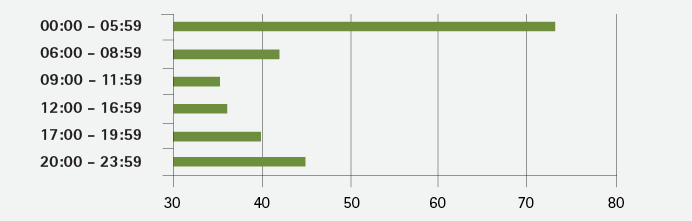
Rescues and Time of Day. Figure 1 depicts the number of rescues per hour related to specific times of the day. Most of the rescues have happened between midnight and 6 a.m. (consistent with when most civilian casualties occur). The next highest number of rescues occurred between 8 p.m. and midnight; 54% of all rescues were made between 8 p.m. and 6 a.m. Some may think that rescues are fewer at night, but the data does not indicate this. Although we could assume to know the reason we are making more rescues during the nighttime, it is likely caused by variables such as more people are at home and more people are under the influence of drugs and alcohol, but a number of different variables almost always affect each measurement, so it’s imperative not to draw conclusions without considering all variables.
Figure 1. Rescues Per Hour of the Day
Many firefighter respondents indicated that they are curious about the validity of on-scene civilian reports or the information gathered from civilians on the fireground. The numbers show that in 41 recorded rescues so far (4%), on-scene civilians (homeowners, family members, neighbors, friends, and so on) reported that “everyone was out” when, in reality, someone was still inside. Some might consider 41 statistically insignificant, but these are still 41 sons/daughters/mothers/fathers/brothers/sisters/friends/neighbors.
The data also indicated that 28% of victim location reports were inaccurate (i.e., civilians stated that no one was inside the fire building when someone was there, an inaccurate number of people were inside, or the occupants were in one room of the house when they were somewhere else). Often, when a firefighter or company/chief officer is told by a civilian on scene that “everyone is out,” the firefighter relays this information to the other firefighters on the fireground, which often leads to placing less importance on search and a decreased operational tempo, which could be detrimental to the people who may still be trapped inside. Conditions and resources, not the civilians on scene, should dictate our strategies and tactics.
Occupancy and Conditions
It probably comes as no surprise that nearly all of the recorded rescues (95%) were made in single-family dwellings (SFDs), multifamily dwellings (MFDs), and mobile homes. SFDs; MFDs; and, to a lesser extent, mobile homes are in nearly every response area across the globe. What might surprise some is that 10 recorded rescues were made in commercial occupancies. Although 10 grabs is only about 1% of the rescues recorded to date, the fact that we are rescuing people from commercial occupancies demonstrates that we should not assume that everyone is out based solely on occupancy type. The “Other” occupancy type box on the survey questionnaire is a catchall that includes care homes (nursing homes, residential board and care, for example), multiuse occupancies, and any other building that doesn’t fit nicely into the other boxes. This data should emphasize that rescue is still our prime directive and that whenever the conditions, resources, and building allow, we should prioritize search.
Also worth mentioning is that the survival rate of rescues made in MFDs (65%) is significantly higher than those made in SFDs (49%). This increased survival rate in MFDs is likely attributed to factors such as additional safety features (fire doors, sprinklers, smoke alarms), smaller units, greater compartmentation, increased fire department response models, and more residents. The vast majority of rescues (96%) were made in buildings with three or fewer stories. Half of the rescues took place in buildings that were two or three stories high. These numbers signify the importance of our being proficient with ground ladders. When operating at fires in three-, two-, and even one-story buildings with a change in grade, using ground ladders to assist with search and rescue should be a high priority.
The Fire
Figure 2 shows the rescue survival rate relative to the exterior conditions on arrival of the first-due. Exterior conditions were defined on a spectrum ranging from “nothing showing” to “smoke only showing” all the way to “>75% fire involvement” (what some firefighters call “fully involved”). Not surprisingly, as the percent of fire involvement increased, the survival rate decreased. Although there is a seemingly aberrant outlier in the survival rate for buildings that were >75% involved on arrival, even when the building was >75% involved, there was a 38% survival rate. Digging a little deeper into the numbers shows us that in the recorded rescues, if the structure was >75% involved on arrival, the average time from arrival on scene to arrival at the patient was approximately 41⁄2 minutes in the instances where 15 of the rescued survived and approximately 341⁄2 minutes in the 24 instances where the occupants died. As we inherently know, time is extremely important for civilians inside a building on fire. This is explored further later in this article.
Figure 2. Rescue and Fire Invovement
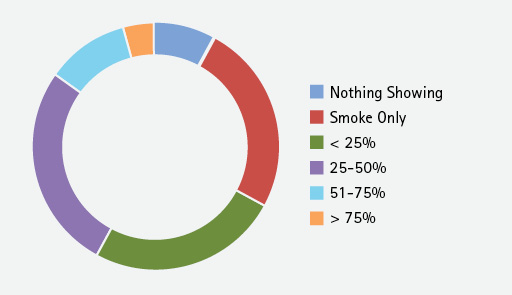
Only 13% of the rescues were made in buildings with >50% fire involvement (Figure 2). Only 3% (39 rescues) were made when the building was more than >75% involved. You can interpret this statistic any way you want; I view it through the lens that we shouldn’t write off an entire building or the possible people inside because of a large volume of fire from the outside. Rather, we should be looking for opportunities to save lives and property (again based on conditions, resources, and the building), as we all know the effectiveness of water and a closed door.
Interior Conditions
Fires on the first floor and on multiple floors had the lowest survival rates (51% and 50%, respectively). These two data sets also account for 72% of reported rescues. In 184 documented rescues to date, fire was present on multiple floors.
The vast majority of recorded rescues (81%) were made in room-and-contents fires and fires with structural involvement; 19% of the rescues were made at incipient-stage fires and when fire was in multiple rooms without structural involvement (rooms and contents) (Figure 3).
If you instinctively assumed that incipient-stage fires would have the highest survival rate and that structural fires would have the lowest survival rate, you would be correct. Incipient-stage fires had a survival rate of 78%, quite a bit higher than any of the other categories. Even in buildings with structural involvement, arguably the most advanced fires, there was a recorded survival rate of 46%. As noted, when there is a large volume of fire inside the building, search decisions (location, type of search, resources, for example) should be based on your ongoing size-up, which includes an exterior and an interior size-up.
Figure 3. Interior Fire Conditions on Entry
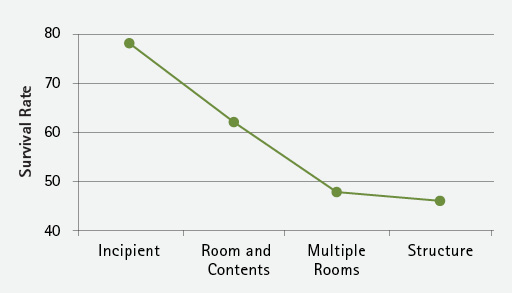
Figure 4. Victim Proximity to Fire
Conditions at the Victims’ Locations
Of the recorded rescues, 74% were made in low and zero visibility. With the visual density and volume of smoke produced from most synthetic materials, low and zero visibility are the not-so-new normals for us. Are we training to this reality?
Questions to ponder: Are we teaching our members the basics of search, the dynamics and effects of tunneling, the advantages of getting low to get under the smoke, and the strengths and limitations of thermal imaging cameras?
Although visibility is obviously subjective and impossible to accurately quantify on working firegrounds, the recorded survival rate data is encouraging in its predictability. As visibility increases, so do the recorded survival rates. Even though visibility and the survival rate are directly related, the recorded survival rate is still >40% (42% actually) when victims are in a zero-visibility environment.
Questions to ponder: How can you enhance your members’ efficiency and effectiveness when working in low- and zero-visibility environments?
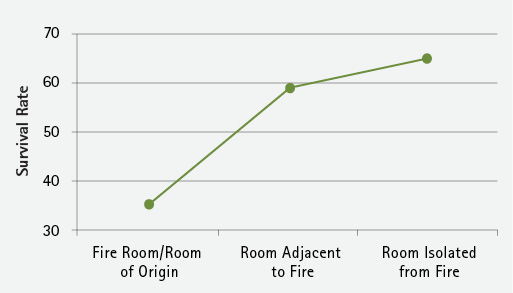
Three things impact the survivability of a given space inside the structure: the physical proximity to the fire, the elevation in the space, and whether or not a closed door is separating the fire from the given space. More than half (51%) of all rescues occurred when the victim was in a room adjacent to the fire room/room of origin and the space was not isolated from the fire. So far, somewhat surprisingly, only 18% of total recorded rescues were of victims behind a closed door.
Not surprisingly, the highest survival rate (65%) was for victims behind a closed door (Figure 4). The UL Firefighter Safety Research Institute (UL FSRI) has repeatedly and empirically shown the benefits of closed doors to civilians and firefighters in a fire. For the past couple of years, thanks to the work of the UL FSRI, there has been a concerted fire service effort to push the “Close Before You Doze” message to our communities. Additional information and tools to help spread this lifesaving message are at https://firstresponders.closeyourdoor.org. The “Close Before You Doze” message is extremely important; when combined with more efficient and effective search and rescue operations, our citizens have the best chance for surviving a fire.
Vacant or Abandoned Buildings
There has been a lot of discussion about what our operational role is when a structure appears to be vacant or abandoned. Shortly after we started collecting data, we added a question to the survey in an attempt to get some experiential data on the topic. In 3% of the total recorded rescues, the structure appeared vacant or abandoned. In these rescues the survival rate was 62% overall; we recorded data of 18 lives that were saved in these structures. The average time from fire department arrival on scene to arrival at the victim was about three times longer in the cases where the victims died (~18:10) than in those cases where the victims survived (~6:11).
Victim Location
Not surprisingly, 90% of the people rescued were from the first and second floors. What is a little surprising, though, is that the survival rate seems to increase the more we travel away from the first floor (Figure 5). Although the total number of recorded rescues in the Basement Division and on or above Division 3 is only 120 (10%), which is a small sample size, this apparent anomaly is worth passing along.
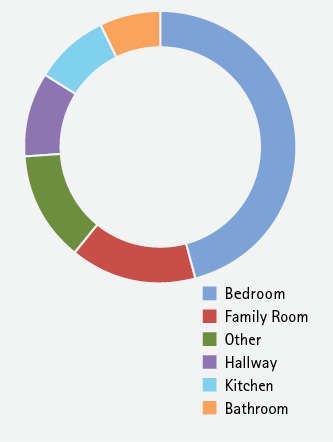
Figure 6 shows that 46% of the recorded rescues were made from bedrooms (where most civilian casualties occur). The breakdowns for other rooms included the family room (15%); other (balcony/deck/porch, foyer, stairs, garage, basement) (13%); (hallway (10%); kitchen (9%); and bathroom (7%). To some, the fact that 46% of the victims were rescued from bedrooms may indicate that vent-enter-search (VES) or vent-enter-isolate-search (VEIS) should always be prioritized. Others may conclude that since 54% of the victims were rescued in rooms other than bedrooms, other types of searches should be prioritized. Neither conclusion is wrong or correct since our tactics should be based on the conditions, resources, building on fire, and other pertinent information on the fireground and not be decided well before the fire. Analyzing a little more detailed data will enable us to compare rescue location with age ranges for children. This data indicates that bedrooms are by far the most common location of the children rescued: 0- to 2-year-olds (71%), 3- to 5-year-olds (75%), and 6- to 12-year-olds (63%).
Figure 5. Victim Location (Floor)
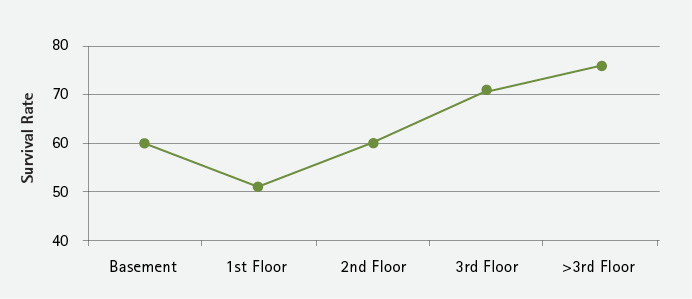
Figure 6. Victim Proximity to Fire
Victim Age
According to the respondents, 84% of recorded rescues were in adults >19 years old and 16% were 18 and under. Looking a little more at the civilians we are rescuing not only humanizes them but also can teach us some valuable lessons to enhance our training and thus our operations.
Questions to ponder: Are you using real people when you train, or are you using manikins? How big are they? Are you practicing moving people that weigh more than 300 pounds? Are you training with your children when you’re at home?
The data related to victim age likely enforces much of what we’ve been taught in our medical training—namely, that the oldest and youngest portions of our populations often have decreased survival rates for specific illnesses; diseases; traumas; or, in this case, smoke inhalation and thermal burns. The three lowest rescue survival rates were for pediatrics <2 years old (43%), peds from 3 to 5 years old (51%), and geriatrics 65 and older (52%). It’s important that we train to rescue and then treat (more on this later) people of all ages.
Questions to ponder: Are you training on locating and rescuing pediatrics? Are you training using cribs and bunk beds? Are you working on moving frail or fragile victims?
Improving Our Operations
Now that we have looked at the statistics relative to rescued civilians, let’s look inward, at ourselves and our operations, to see where we can best focus our efforts to effect more rescues and give victims the best chance for surviving the effects of fire.
Who Is Rescuing Victims?
The data shows that the majority of victims (58%) were found through the primary search, followed by fire attack (26%). The remainder of the victims were recovered by “other” means: the incident commander, backup/on deck, rapid intervention team, secondary search, salvage and overhaul, the police department, and ventilation. It’s no surprise that victims were found by primary searchers and attack, as they are typically the first crews inside the buildings. That more than a quarter of the victims were found by the Attack Group might surprise some, however. This proves that attack is search and we must, therefore, act and train accordingly.
Questions to ponder: Are your Attack Group members, both with and without the nozzle, performing a quick, body-length search when the attack pauses for a couple of seconds during their advance? How quickly after the fire is knocked down does the crew perform hydraulic ventilation and start their primary search? What happens when you find a victim during your attack? Does the entire crew remove the victim? Does one member remove the victim? If so, who? Do you go past the victim and continue your attack? Because of a myriad of variables (size of victim, number of members of crew, fire conditions, distance to exit, for example), there is obviously no single answer to some of these questions, but the first time the Attack Group discusses what to do when they find a victim should not be when they find one.
Primary search (57%) has a survival rate of nearly three times that of secondary search (21%). Primary search also has a slightly higher survival rate than attack (54%). Although it probably is not surprising that salvage and overhaul has a survival rate of 10% (n = 29), it may be shocking that the police department has a recorded survival rate of 94% (n = 18). The fact that police officers, with likely little to no training when it comes to search or rescue on the fireground, are batting almost a thousand is extremely encouraging. We could let our egos get in the way here; instead, let’s just give these brave law enforcement officers a congratulatory tip of the helmet.
The Search Group
The Search Group rescues were broken down into five search types: left-hand/right-hand (LH/RH), split, oriented, VES/VEIS, and using a search line. Each type of search was defined to avoid confusion and to obtain more accurate data. Even though the search types are not mutually exclusive, this information is valuable nonetheless. Most rescues made by the Search Group were while performing a split search (38%), followed by LH/RH (26%), VES/VEIS (19%), oriented (17%), and using a search line (<1%).
Questions to ponder: Are you training on each type of search? Are you teaching your members when it’s appropriate to perform each type of search? When was the last time you drilled on search or using a search line?
Survival Rates. The survival rates for each type of search, except the search line, were around 50%; the search line results were (20%, n = 5), which is significantly lower. We’ve anecdotally known for generations that VES/VEIS saves lives; now we have proof from dozens of VES/VEIS rescues from around the globe. The recorded VES/VEIS survival rate is currently 48% (n = 132), which speaks to its efficacy.
Questions to ponder: Is VES/VEIS in your playbook? When was the last time you trained on it? When would you consider searching past the door?
Thermal Imaging
FRS is now collecting data on whether the search crews used a thermal imaging camera (TIC). This data set was not initially collected; but, since we started collecting it, we learned that a TIC was used in 37% of the rescues made by search crews and the survival rate was 47%. A TIC was not used in 63% of recorded rescues performed by search crews, and the survival rate was 58%. These numbers might seem a little counterintuitive. Although numerous variables may factor into these results, we should be asking ourselves some questions.
Questions to ponder: Do you fully understand the advantages and limitations of your TICs? Are you training to look for victims who are lighter, darker, and the same color as their surroundings (yes, all three are possible, but that’s a whole other article)? Are you focusing too much on the screen/camera and neglecting proper search techniques?
Initiation of Search. Looking at when search was initiated relative to other fireground tasks, we can learn how to enhance our operations. Specifically, we looked at when search was initiated relative to the fire’s being knocked down and to the establishment of RIT. The data shows there were only six recorded successful rescues (meaning that the victim survived) when search was initiated after RIT was established. The data also shows that in 89% of the successful grabs, search was initiated before the fire was knocked down. The survival rate was 60% (n = 938) when search was started before the fire was knocked down. On the other hand, the survival rate was only 34% (n = 206) when search was started after the fire was knocked down.
Figure 7. Time to Arrival at Victim
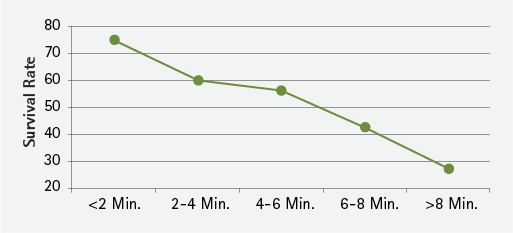
Figure 8. Removal Time
Time and Rescues
We all intuitively know that time is of the essence on the fireground; that’s why we stage our bunker gear so it’s ready to be donned quickly; have lights, sirens, and Opticoms on our rigs; and train the way we do. Now, FRS has data to confirm this fact. The time-related graphs are likely the most telling data sets from FRS. There is an obvious direct correlation between speed and survival, meaning that the faster we locate and remove victims, the better it is for them. The survival rate when victims were located in <2 minutes is 75%; it consistently decreases to 28% when it takes >8 minutes to locate someone (Figure 7). Really! Let this sink in.
Questions to ponder: How does your department prioritize search? How many members are typically tasked with search? How fast are we sending members in to search?
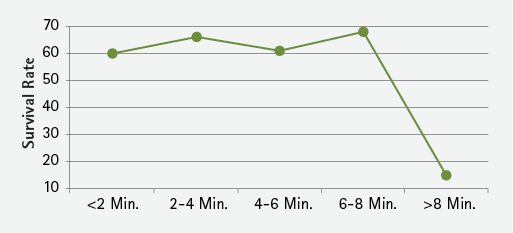
Time from Victim Discovery to Victim Removal. Although there are obviously times when sheltering in place will be beneficial, the majority of the time it is advantageous to remove the victim from the structure as expeditiously as possible. The data shows that in 64% of the recorded rescues, victims were removed from the structure in <2 minutes from the time they were discovered and that 79% of the time it took less than 4 minutes.
Survival rates hovered around 60% if removal took 8 minutes or less (<2 minutes = 60%, 2-4 minutes = 66%, 4-6 minutes = 61%, 6-8 minutes = 68%) (Figure 8). However, the survival rate dropped to 15% when removal took >8 minutes. Again, there are multiple variables that affect removal times and victim survival rates, but 15% seems pretty black and white.
Time from Arrival of Fire Department to Victim Removal. In reference to the hazards inside the fire building, UL FSRI Research Engineer Robin Zevotek states: “Exposure duration is as important as, if not more important than, dose.” It seems as though Zevotek might be onto something. The data shows that the longer a victim is inside the fire building, the worse it is for the victim (as always, there are exceptions). The survival rate numbers recorded are the following: <2 minutes = 67%, 2-6 minutes = 60%, 7-10 minutes = 57%, 11-14 minutes = 39%, 15-20 minutes = 43%, 21-30 minutes = 22%, and >30 minutes = 5%.
Victim Removal
When FRS first initiated the survey, respondents could choose more than one answer to the question of how victims were removed; the survey has been simplified to make the data easier to analyze and be more useful to the fire service. Now, respondents select the “best answer.” The responses revealed that 75% of the removals from the structure were by firefighters actually using their hands to remove the victim from the structure, followed by ground ladders (10%), victims exiting the structure under their own power (10%), using a stokes basket or stretcher (4%), and using an aerial ladder (<1%).
Means of Removal and Survival Rates. When victims exit under their own power, the survival rate is nearly 100% (actually 99%). The next highest survival rate is among the group removed by ground ladders (76%), followed by “Hands On” (52%), aerial ladder (33%), and stokes basket or stretcher (17%).
Number of Rescuers Needed for Removal. Obviously, the route and speed of victim removal are dependent on, among other things, the fire/building conditions, your resources, the distance to the exit, and the victim. Respondents reported that about two-thirds of the time the victim was removed by one (23%) or two (43%) rescuers; 18% of the time, three rescuers were involved; 15% of the time, four to six rescuers were involved; and 1% of the time, more than six rescuers worked to remove the victim from the fire building.
Survival Rate and Number of Rescuers. According to the data, there was an apparent inverse relationship between the survival rate and number of rescuers involved in the rescue—the greatest number of rescuers, the lowest survival rates, and vice versa. The survival rates were as follows: one rescuer (69%), two rescuers (57%), three rescuers (49%), four to six rescuers (46%), and seven or more rescuers (6%). As always, multiple variables are responsible for these results.
Medical Treatment for Patients
Although locating and removing victims trapped by fire is our prime directive, it is not the end of our job. Once we have gotten the victims out of the fire building, we still have to treat them and get them to definitive care. Obviously, not all fire departments perform emergency medical services (EMS) or transport patients/victims to the hospital, but ALL fire departments are responsible for making sure that EMS is on scene and ready to treat and transport victims once they have been rescued.
>Questions to ponder: Is a dedicated ambulance dispatched to your fires? If so, when is it dispatched? If not, why?
Types of Treatment
Responses indicated that 28% (n = 378) of the rescued victims, at some point in their care, were in cardiac arrest and cardiopulmonary resuscitation (CPR) was performed. During our biennial CPR refresher courses, we hear from the American Heart Association that the patient survival rate drops 10% for every 60-second delay between cardiac arrest and CPR. According to the data collected, the survival rate was 73% (n = 115) for victims given hydroxocobalamin (Cyanokit), 68% (n= 422) when the victim is transported to the emergency department first, and 77% (n = 177) when the patients are initially transported to a burn center. As already alluded to, this survey has been fluid for the past three-plus years, and for analytical reasons we no longer differentiate among victim destinations.
Victims’ Condition on Removal
Victims survived 48% of the rescues when they were unconscious (with pulses) on removal; 32% of the time they had third- and fourth-degree (severe) burns (with pulses); and, as mentioned above, 28% of the time when they were in cardiac arrest at some point in their rescue, treatment, or transport. This shows that life can be extremely resilient even in the most hostile of environments: Even with severe injuries, life finds a way to survive. This also speaks to the ideology that we shouldn’t be so quick to write off people or areas of a building: If we can occupy the space, we should.
Victim Outcome
The data has shown an overall survival rate of 55% to date. Because of the difficulties many fire departments have had in following up with patients they rescued, the definitions of “alive” and “deceased” have been moving targets. Currently, we are defining “alive” as anyone who had a pulse on removal from the fire building. This is not a perfect definition; we are still working on making this extremely important data point as usable to the fire service as possible.
Much of what is presented here is not new; it’s information we’ve known for decades. Likewise, many of these lessons were learned before through experience and shared by brothers and sisters before us. FRS collects, combines, and catalogs experiential “evidence” shared by firefighters across the globe. This data is important, no doubt, but this is only the beginning. As we collect more data and get better at the analytics, we will share this information with the entire fire service, which can use it to become more efficient and effective. If you have any thoughts on how to improve FRS, please reach out to us. FRS thanks all of the firefighters who have made rescues and have taken the time to respond to the survey, helping to enhance all of our training and operations.
Note: The ultimate goal of this project is to get the fire service to see value in collecting this information and then have a larger organization (we’re looking at you, National Fire Incident Reporting System and The National Fire Operations Reporting System) take what we have started and run with it. We know they have the knowledge and resources to take this idea to the next level.
NICK LEDIN is a firefighter paramedic with the Eau Claire (WI) Fire Department, assigned to Truck 9/Medic 9. Ledin is a 13-year fire service veteran and is an instructor with Chippewa Valley Technical College and Central Lakes College. He’s a contributor to “Firefighter Rescue Survey,” an FDIC International instructor, and the former president of the Northland F.O.O.L.S. He’s a technical committee member for NFPA 1700, was a former technical panel member for UL FSRI’s PPA/PPV study, and was a co-host of International Perspective on Fire Engineering Blog Talk Radio. He is an affiliate member of FireNuggets Minnesota/Wisconsin.

