TESTING BUILDING FIRE PUMPS PART 2
This article is part two of a two-part article that provides a synopsis and practical applications of NFPA 20, Installation of Centrifugal Fire Pumps, and NFPA 25, Inspection, Testing and Maintenance of Water Based Extinguishing Systems. (Part 1 appeared in the March 1992 issue of Fire Engineering) Let’s continue that discussion by analyzing fire pump testing procedures and recording, graphing, and evaluating data.
PRETEST CHECK
For new installations, flush and hydrostatically test the piping system. Run the pump at shut-off (no flow, also called churn). Using a tachometer, verify’ that the pump and driver are operating at rated speed. (Possible reasons they may not be running at rated speed are discussed later.) Also, check that the air-release valve and circulation-relief valve are functioning properly, and adjust the pump glands for a slight trickle, as recommended by the pump manufacturer. Next, adjust the pump pressure relief valve, if provided, to the rating of the fittings (usually 175 psi). Observe and note all readings of engine instruments (for diesel-driven pumps) and controller pilot lights, and check if indications are proper. For instance, for a diesel engine, check if there is a high temperature reading, which may indicate a cooling-system failure. Check the pump and driver for excessive vibration or noise. If you detect an electrical or mechanical problem at any time while testing, terminate the test until the source is identified and corrected by qualified professionals.
TEST DATA
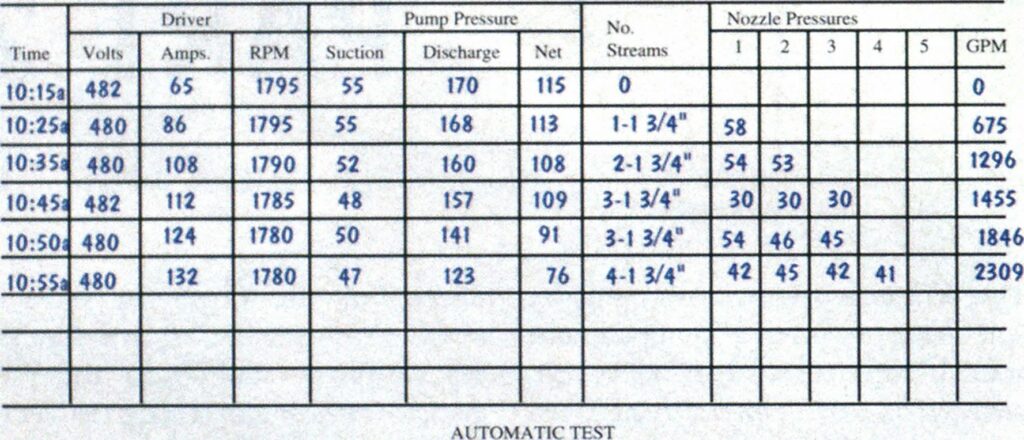
Every pump test should include recording the following data as a minimum for each flow, but you may wish to set up a data sheet such as the one on page 60.
- Pump speed (rpm).
- Electric motor supply voltage and current (if electric pump).
- Suction pressure.
- Discharge pressure.
- Net discharge pressure (discharge pressure minus suction pres-
- sure).
- Flow (gpm) under the following three conditions: shut-off, rated load (100 percent of flow and pressure), and peak load (150 percent of flow and at least 65 percent of net pressure) or as large a flow as possible without drawing suction pressure to less than zero psi at the suction gauge when drawing from a public water system. Note: Where the public water supply cannot deliver 1 50 percent of rated pump capacity, NFPA 20 considers the test acceptable if the pump discharge flow and pressure meet or exceed system demand. Also, if a pump is drawing suction from a ground-level reservoir, at higher flows suction pressures may drop below zero psi while the discharge flow and pressures satisfy system demand.
To obtain data for a smooth test curve, you should record sets of these data in 250-gpm increments starting from shut-off. Note: At shut-off, net discharge pressure must not exceed 1 20 percent of rated pressure for a horizontal or vertical shaft split-case pump or 140 percent for a vertical turbine or end suction type. Since the 1987 edition, NFPA 20 has permitted a maximum shut-off pressure (discharge pressure) of 140 percent of net rated pressure for “any type of pump.”
INITIATING THE PUMP TEST
With the pump driver running, begin by recording data for the pump test at shut-off. Next, with the pump still running, open one hose valve, wait for a steady flow, and take a second set of readings. Then, open a second valve and take readings, and so on, up to peak load.
If a flow meter is provided for testing the pump, follow the procedures in the box below.
If the pump draws suction from a public main, starting from shut-off and approaching peak load in steps aids in ensuring that the pressure at the pump suction flange does not drop below zero psi. If opening another hose valve will cause a reading of less than zero psi on the suction gauge, then conclude this part of the test.
During the test, if the pressure at the pump suction gauge drops excessively with each increase of flow, install a hydrant cap pressure gauge on the hydrant nearest the suction piping connection and compare results to determine if the problem, such as a partially or totally closed valve, is in the public system or private lines. If there is such a problem, stop the test until it is corrected.
FIRE PUMP TEST
NAME ABC Company_
ADDRESS: 1234 Main St.-
CITY Centerville_ STATE_LL_ ZIP: *2345
SEC Location No. I _!Customer ID No-1-
ENGINEER W.A.D._ DATE Pec,4. 1979_
PUMP AND MOTOR DATA
PUMP Manufacturer XYZ_ Type Horiz. Split Case
Capacity 1500_ GPM Pressure 100 psi RPM 1770
DRIVER: Manufacturer _Power Company_
H.p. 12$_ Volts 460_ Amps. 142_
TEST DATA

Start:__psi Stop:_ill-psi Time:—Z-minutes
REMARKS_
*Note: The fourth reading was taken with the wives partially closed to provide another point on the performance curve.
If pressure at the pump suction gauge drops and remains low with the pump operating at shut-off, inspect all piping downstream of the pump for leaks, including the pump relief valve. If no leaks are observed, call the local water utility to see if a problem with the public system is causing a lowpressure situation.
With a vertical-turbine pump, the vertical distance from the center of the discharge pressure gauge to the water level should be noted at each test point and converted to psi (feet x 0.433) and added to the pump discharge pressure. This correction allows you to compare net pump performance with the manufacturer’s test curve more accurately. Keep in mind that the system design is based on indicated pump discharge pressures at design flow.
After enough sets of data are recorded to compare the net pump performance with design, stop the pump driver. With the pump at rest, open all test valves or the flow meter throttle valve wide and manually start the pump at least once to see if the driver quickly will reach operating speed under peak loads. This will reveal if there is a problem that would prevent the driver from accelerating to rated speed, such as the circuit breaker tripping (for motor-driven pumps) or excessive engine wear (for diesel-driven pumps).
While running at peak load, transfer to the emergency or secondary power source, if provided, to ensure that it is operating properly. The transfer switch usually is located within the pump room or in the controller. After power transfer, shut the pump off and transfer back to the primary power source.
CONTROLLER TESTS
At the end of the test, the start and stop pressure points should be verified for each pump, including the jockey pump. Guidelines and an example of selecting these points is given in the box below.
NPFA 20 recommends that an original acceptance test include 10 automatic and 10 manual starts and stops on the pump to verify proper controller operation. Failure to allow adequate time between starts of an electric motor-driven pump may cause controller or motor damage due to overheating of components.
If the pump controller is set up for automatic stop, the minimum run period timer should be set for 10 minutes for an electric motor or 30 minutes for a diesel engine. If the pump provides the only source of water to a sprinkler or standpipe system, NFFA 13 and 20 require that the pump have manual shutdown only.
After the test, the pump pressure relief valve (if provided) should be set to open just above shut-off or slightly below’ the pressure rating of the system components. The circulation relief valve should open only at flows near shut-off and close as flows through the pump increase. The packing glands should be set to provide the recommended seep while the pump is operating, but they may drip slightly when the pump is stopped.
Pitot Gauge Conversion Chart

EVALUATING DATA
After all tests are complete, return all valves and controls to “normal” operating conditions. After converting each nozzle pressure to gpm using the Pitot Gauge Conversion Chart (left), calculate total flows for each set of data. Plot curves for suction, discharge, and net pump performance on semilog graph paper. (You may find it convenient to photocopy the manufacturer’s or previous test curve and plot your data on it.)
Compare the plotted net pump performance curve with the manufacturer’s characteristic curve (which is developed at the factory when the pump is new), the previous test curve, or data plate points. If the newnet pump performance curve is lower than the previous data and the test speeds (rpm) were less than rated or than in previous tests, the test flow’ and pressure points should be corrected for the difference in pump speed.
To correct for rated speed, you have to calculate a new flowand pressure for each set of data using data from the test and from the previous test or factory. For capacity, use the equation Q = (N2/N,) X Q,, where Qi = capacity at test speed in gpm, Q2 = capacity at rated speed in gpm, N, = tested speed in rpm, and
N2 = rated speed in rpm. To calculate for head, H2 = (N2/N,)2 x H,, where H, = head at test speed in feet and H2 = head at rated speed in feet.
Correction of the pressure and flowresults to rated pump speed is a troubleshooting tool that helps determine the causes of poor pump performance. If, after correcting the pressure and flow values, the test curve and the factory curve are nearly identical, then the drop in pump performance is due to the pump driver not driving the pump at rated speed. Remember that the pump installation cannot be considered satisfactory unless the pump satisfies the hydraulic requirements of the systems it supplies.
TEST CURVES
The following scenarios and graphs illustrate some of the different curves that may indicate problems and some of the causes.
Occasionally the test curve will be higher than the factory test curve. With an electric motor driver, this occurs particularly where it receives a higher voltage than that for which the motor is rated. If the voltage is more than about 10 percent higher than the motor’s rating, the problem needs to be corrected. With a diesel engine driver, if the engine governor is set for rated speed at peak load (as required by NFPA 20), most pressure points on the test curve will be higher than the certified curve at lower flows. This is acceptable.
PERFORMANCE CURVES

COMPARISON OF NET PUMP PERFORMANCE TEST DATA AND FACTORY CURVE

A) • Obstructed discharge gauge or pet cock closed
B) • Obstructed suction gauge or pet cock closed • Plugged impeller

• Relief valve pilot screen clogged
Pump relief valve set too low

A) • Low speed of motor B) • Engine speed governor
• Wrong impeller diameter set at shutoff (no-flow)
• Worn wear rings or impeller

• Impeller backward
• Reversed rotation – ______II__ L_.I..~_…_J
Low voltage may cause a motordriven pump to test low. At times it is possible to correct the cause of low voltage by arranging for a new electric service.
If the diesel-engine speed is set at shut-off, most of the test curve will plot low. This can be corrected by having an experienced mechanic adjust the governor to rated speed at peak load.
If the plotted curve of the test results is more or less parallel to but below the factory curve and the pump speed is reasonably correct, have the impeller inspected for obstructions and the clearance between the impeller and the wear rings checked.
If the suction gauge pressure is low, check for closed valves or other problems in the suction piping or city water mains near the site. T his can be verified by installing hydrant cap gauges on the nearest city hydrants upstream of the pump and rerunning the test flows. This will allow you to locate the problem. The tests should be terminated until the problem is rectified.
With the pump operating at shutoff, if pressure at the pump suction gauge drops and remains low instead of returning to normal suction pressure, inspect all piping downstream of the pump for leaks, including the pump relief valve. If no leaks are observed, call the local water utility to see if a problem with the public system is causing a low-pressure situation at the site.
W hen testing an old pump installation, often neither the data plate nor previous test results are available. If the pump capacity (gpm) and driver horsepower (hp) are known, estimate the rated pressure by using the following formula, assuming that the pump efficiency is 65 to 90 percent (0.65 to 0.90). For pressure, H (3960 X e x hp)/Q, where 11 = rated head in feet, e = efficiency, hp = horsepower, and Q = rated flow in gpm.
To use this formula, plug in rated flow, estimated efficiency, and horsepower to find the rated head in feet. Multiply this value by 0.433 to get rated head in psi. Rated capacity sometimes may be determined by comparing pump suction and discharge piping sizes with those in NFPA 20, Table 2-20.
Remember, the important point of building fire pump testing is to determine if the pump installation will deliver sufficient flow and pressure to satisfy the system demand.

