
By Troy A. Phillips
The fire service industry is undergoing significant overhaul. Certainly, the past 50 years have brought immense improvement with regard to innovation on the subjects of firefighter safety, process, and equipment–but how do we navigate the crossroads when effectiveness and efficiency of operational execution meet fiscal stewardship?
More than ever, fire department administration is as much about numbers, statistics and trends as it is personnel management and emergency services delivery. In one form or another, we’ve all experienced the changing expectations of the digital era: readily accessible information, live stream updates, open source data, etc. How then do we as service providers stay ahead of the curve?
As the adage goes, “If you can’t beat them, join them.” The future success or failure of a fire department will depend entirely on its ability to collect, monitor, and analyze relevant information in an accurate and meaningful manner.
Now before you push your chair back and say that you don’t have the resources or the know-how, hang tight.
Chances are, you’re spread thin trying your best to serve the community while running multiple programs and functions at once, all of which are probably understaffed and underfunded. So where to begin? What data do we evaluate? Where is this data, anyway?
You are not alone. The Pasco (WA) Fire Department was struggling to answer these same questions only a few short months ago. Yet if a deputy fire chief with an Idaho education has the grit and willingness to take on the collection and evaluation of performance metrics, so do you (no offense to all you Idahoan readers.)
RELATED: Smart Data for Smarter Firefighters, Part 1 | Big Data in the Fire Service | The Dangers of Data | Is the Fire Service Trading Effectiveness for Efficiency? Data and a Lack of Resiliency
When approaching such an amorphous problem, it helps to break things down into manageable portions. The Pasco Fire Department (PFD) came up with a concept called “Pillars of Excellence,” which maintains that core components of a department can be boiled down to a few categories–or pillars, for the sake of analogy–that will ultimately result in the general success of the department. The stronger each pillar, the stronger the department as a whole.
The approach is simple. Write down any and every important aspect of your operation, including information or metrics you currently have access to and those that you don’t. Develop a good mix of ideas, compile them in like categories, and let the concept begin to take shape.
The PFD, a municipal all-hazards career department, developed the following pillars, specific to its operation:
- Operational readiness
- Community wellness
- Cost containment
- Operational performance
- Department quality
Through performing the exercise, the team was able to take a holistic view of the department and identify areas where feedback or reporting mechanisms were already in place (and those areas that were not.) Over the course of several weeks, the team compiled the metrics originally outlined, keeping things under control by establishing a one-year lookback for data collection.
An Example
When evaluating the pillar of operational readiness, apparatus reliability was identified as a key metric or key performance indicator (KPI). Apparatus reliability was not a KPI the PFD readily tracked, but was one that could be developed; All PFD staff use fuel cards specific to a given vehicle. By reaching out to the fuel vendor, the department was able to obtain figures regarding gallons pumped to each vehicle and the amount charged per fueling. Luckily, PFD’s vendor also required mileage input at the time of fueling, so the team got that info, too. After pairing each fuel card number with the respective apparatus, the group calculated the total gallons consumed and total mileage applied for each vehicle during the year. By dividing fuel cost by total miles, the department was able to compile a listing of cost per mile for each vehicle.
This figure led to a new series of questions. What about maintenance costs? What other costs go into this vehicle ever year? What is the true cost per mile for each apparatus? Anxious to find the answer, the team reached out to the fleet service department and requested maintenance cost per vehicle for the year, in addition to any invoices from third-party vendors. By compiling this information, the team was able to graphically illustrate the cost per apparatus against its usage, calculated by cost per mile versus the total change in mileage throughout the year. The result came in the form of a compelling graph that starkly identified which vehicles were underused or costly to maintain. Vehicles with a low blue bar and a high line point indicate low usage/high cost, as seen below:
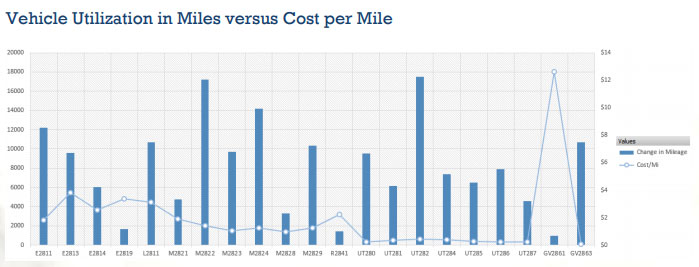
Instead of anecdotally claiming the department needed to replace an engine, department executives were now able to empirically defend the need for funding to support equipment replacement by illustrating how a given apparatus was significantly underperforming when compared to others like it.
RELATED: Is Big Data Analytics The Secret To Successful Fire Fighting? | Fighting Fires with Data | Report: Boston Uses Data to Improve Firefighting Efforts
This is only one of numerous examples. The department ultimately compiled a report of nearly 60 key metrics supporting its various pillars of excellence.
The PFD’s performance report was not crafted using complex data structures or whiz-bang algorithms- it’s simply the result of good, old-fashioned hard work and persistence. Think about what matters, and how you might gauge the success of a given function. If you don’t have a mechanism for collecting that information, how can you empower your staff to establish a process to make it happen?
The most important takeaway is this: Compiling performance data is not a finish line. Rather, it is a baseline, a starting point, a foundation upon which you can ask questions and begin to build mechanisms to capture important and meaningful information to empower a more informed decision tomorrow.
If you would like to view the Pasco Fire Department’s full report, it may be accessed at: http://www.pasco-wa.gov/DocumentCenter/View/59650
Troy A. Phillips is a senior management analyst for Pasco, Washington.

