BY PAUL LUIZZI
The fire service is constantly being chall-enged to change the way it operates when spending taxpayers’ money. In private industry, the focus on bottom-line performance and maximization of wealth for shareholders is imperative for its survival. Public agencies are being asked to show performance-based outcomes associated with tax dollars expended.
HISTORY OF PERFORMANCE MANAGEMENT
In the late 1970s, Dr. Aubrey C. Daniels introduced the concept of performance management, a technology (i.e., science imbedded in applications methods) for managing behavior and results, the two critical elements of performance. Performance management is used primarily in business; however, it can be used in any venue. Managing employee or system performance facilitates the effective delivery of strategic and operational goals. There is a clear and immediate correlation between using performance management programs and improved organizational results.
Performance management is an important tool for communicating the strategy of the organization to maximize efficiency. The efficiency is appreciated when employees understand the expectations of the organization and the vision. Clearly identifying the goals of the organization is the first step in performance management.
CASE STUDY
The Goodyear (AZ) Fire Department (GFD) was created as a volunteer fire department in 1948. Today, it is a career all-hazards emergency response organization that provides fire, rescue, and hazardous materials response as well as emergency medical services to a population of more than 64,000 citizens. GFD has belonged to the Phoenix Regional Dispatch Consortium “Automatic Aid” since 1999. Additionally, the department oversees comprehensive fire prevention, building safety, emergency management, and community education divisions.
Changing the Focus
At the beginning of fiscal year (FY) 2008/2009 (July 2008), the department completed a comprehensive look for a way to better manage the performance of the divisions and how to properly communicate that information. The first priority was to figure out what the performance measures were going to be and in what format they would be reported. The easiest way to focus on strategic goals and results was to use the balanced scorecard as our platform.
The balanced scorecard was created by Robert Kaplan and David Norton of the Harvard Business School. The balanced scorecard suggests that we have a balanced view of the organization from four perspectives: customers and markets; process improvements; financial management; and creativity, innovation, and learning. The reason organizations select these quadrants to analyze is that improving performance in the objectives found in the learning and growth perspective (the bottom row) enables the organization to improve its internal process perspective objectives (the next row up), which, in turn, enables the organization to create desirable results in the customer and financial perspectives (the top two rows).
Moreover, the balanced scorecard helps to develop metrics, collect data, and analyze the data relative to what is important to your department. This is the greatest power of the balanced scorecard.
As with any new process, it is vitally important that you engage the end-users and stakeholders early in the game. As the deputy chief of operations, I held weekly meetings with the shift battalion chiefs to discuss the benchmarks that they would want to begin tracking. We looked at each quadrant and began to define the metrics we wanted to track. Since we wanted to directly tie these metrics in with our strategic plan, we worked in concert with the vision of the department. These metrics may not apply to all departments, but they were important to ours.
After developing the metrics, we began to monitor our performance on a quarterly basis. This balanced scorecard did not focus only on operations; all divisions were required to implement this process. Metrics were reported quarterly to the executive staff and then were rolled out to the senior staff through the dashboards. Dashboards contain our metrics in a quick snapshot so that our managers can see them in advance of the quarterly report. Senior staff would then be able to quickly relate this information to their supervisors. This was a twofold process: The scorecard was a communication tool for the strategic mission of the organization with its direct reports on what the department was measuring; the scorecard also showed the supervisors what their managers were being held responsible for and how they could work together to achieve positive results.
As the first dashboards were rolled out, members did not receive them in a positive manner. As with any changes, they caused some “push back.” The department worked through this process slowly, answered all the concerns, and kept in communication with everyone (a priority). Ultimately, we aligned the department’s strategy with what our people do on a day-to-day basis. At the end of the first year, all divisions fully accepted the system, and we began reporting our data.
Quarterly Business Review
As we assembled our balanced scorecards for the FY 09-10, the executive staff began to develop the reporting. The group decided to hold quarterly business reviews (QBR) for all fire department sections during the senior staff meeting. Managers would be responsible for reporting on their sections. During their presentations, they were subjected to questions about variations in their reports and what their plan was to make corrections, if needed. This allowed the managers to focus on the areas that needed improvement and to work directly with the involved supervisors on the plan to refocus and move forward in a positive manner. This process identified best practices and enabled us to share our successes with the department.
For the kickoff meeting, the administrative staff reviewed the entire process and the rules of engagement for each presenter and how each slide would look. Participants could make changes to the format or ask questions. The first QBR was a dress rehearsal, and frequent feedback was given to the presenters. Initially as with the balanced scorecards, members had some trepidation, especially with regard to being put on the spot about variations for their respective sections. However, by the fourth QBR, the process worked very smoothly, and we started to invite in outside guests to show off our success.
Outcomes and Impacts
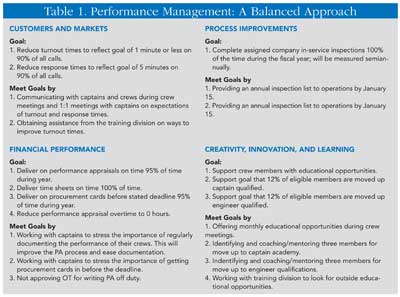
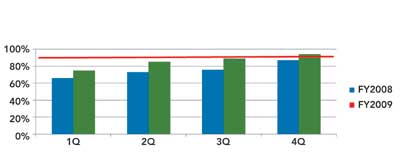
The biggest impact on the organization was an acceptance of performance management and the reporting of that information. The culture now accepts the information and has recognized that by working together, we can provide a more efficient level of service to our community and citizens. Progressive improvement was evident in our turnout times and delivery of performance appraisals. To highlight the process, we looked at two performance metrics that were below our level of expectation and which could have a significant effect on the way we delivered our services to our internal and external customers. Across the continuum, you can see where we first developed the balanced scorecard metrics and then how we progressed to where we were more consistently hitting our stated standards. The graphs (Figures 1-3) highlight the importance of paying attention to the details and drilling on the issues. Figure 1 shows the goal of having appraisals available on the due date 95% of the time. Figure 2’s goal is 1 minute or less 90% of the time. Figure 3 depicts the goal of a move-up capacity of 12 percent.
| Figure 1. Shift A: Performance Appraisals Due |
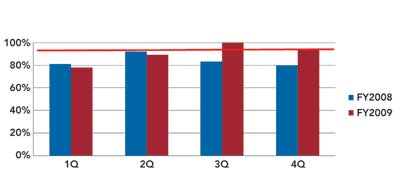 |
| Figure 2. Shift A: Turnout Times |
 |
| Figure 3. Move-Up Capacity |
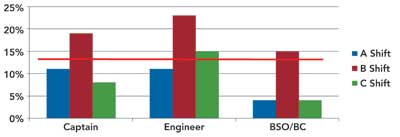 |
We used best practices between the shifts and explored how other divisions could help us deal with substandard performance. An example would be working with the training division so that it could assist us in developing “move-up capacity” to help keep our overtime costs down. This open learning environment fostered the department’s ability to work together and perform as a highly efficient team. As evidenced by our training metric, it was not always about improving our work. For example, it was recognizing from a strategic standpoint how we could develop our personnel for the future and reduce our overtime costs. We established the 12-percent mark because that represented the number of personnel that were off each shift from the previous fiscal year. Previously, we would support those open shifts with overtime; with a reduced overtime budget, we needed a new way to backfill those mission-critical positions.
Performance management is now an embedded process in GFD. The division managers having management control has had a positive impact on how they manage their divisions on a daily basis-compare current performance with past performance, and base the goals on what your organization wants to measure. The fire department can become very efficient when performance management is used. In the end, the entire organization benefits when members understand the strategy and vision. Furthermore, we have realized that by working together, we can dramatically change a culture in a department and positively affect our community.
PAUL LUIZZI was appointed interim deputy city manager for the City of Goodyear, Arizona, in July 2011. Previously, he served as Goodyear’s interim fire chief (two years), deputy chief of operations, and battalion chief. He has more than 23 years of fire and EMS experience serving public safety organizations in Massachusetts and New Hampshire. He earned his certification as public manager from Arizona State University, an MBA from Franklin Pierce University, and a BS degree in public administration from Roger Williams University.